FIGURE
Figure 3
- ID
- ZDB-FIG-240226-166
- Publication
- Raman et al., 2024 - The Osteoblast Transcriptome in Developing Zebrafish Reveals Key Roles for Extracellular Matrix Proteins Col10a1a and Fbln1 in Skeletal Development and Homeostasis
- Other Figures
- All Figure Page
- Back to All Figure Page
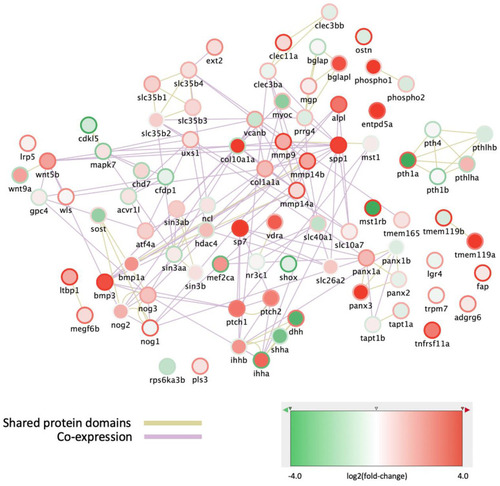
Figure 3
|
Expression changes in osteoblast subpopulations of genes involved in bone mineralization and ossification. The nodes represent genes, outer ring color represents the log(fold-change) between “All” to the P1 subpopulation, while the fill color represents the log(fold-change) between P1 and P2 subpopulations. The network was generated in Cytoscape, using the GeneMANIA databases for zebrafish Shared protein domains and Co-expression. |
Expression Data
Expression Detail
Antibody Labeling
Phenotype Data
Phenotype Detail
Acknowledgments
This image is the copyrighted work of the attributed author or publisher, and
ZFIN has permission only to display this image to its users.
Additional permissions should be obtained from the applicable author or publisher of the image.
Full text @ Biomolecules

