
Figure 1
- ID
- ZDB-FIG-230814-220
- Publication
- Barlow et al., 2023 - The zebrafish mutant dreammist implicates sodium homeostasis in sleep regulation
- Other Figures
- All Figure Page
- Back to All Figure Page
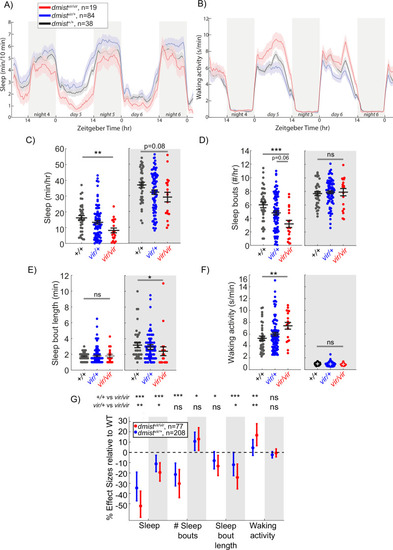
A viral insertion mini-screen identifies a short-sleeping mutant, dreammist. (A, B) Mean � SEM sleep (A) and waking activity (B) of progeny from dmistvir/+ in-cross from original screen. White blocks show day (lights on) and grey blocks show night (lights off). Data is combined from two independent experiments. n indicates the number of animals. (C?F) Analysis of sleep/wake architecture for the data shown in (A, B). (C) Quantification of total sleep across 2 d and nights shows decreased day and night sleep in dmistvir/vir. Analysis of sleep architecture reveals fewer sleep bouts during the day (D) and shorter sleep bouts at night (E) in dmistvir/vir compared with sibling controls. (F) Daytime waking activity is also increased in dmistvir/vir. The black lines show the mean � SEM, except in (E), which labels the median � SEM. *p<0.05, **p<0.01, ***p<0.001; ns p>0.05; one-way ANOVA, Tukey?s post hoc test. (G) Combining five independent experiments using a linear mixed effects model with genotype as a fixed effect and experiment as a random effect reveals dmistvir/vir larvae have decreased total sleep and changes to sleep architecture during both the day and night compared to dmist+/+ siblings. Plotted are the genotype effect sizes (95% confidence interval) for each parameter relative to wild type. Shading indicates day (white) and night (grey). p-Values are assigned by an F-test on the fixed effects coefficients from the linear mixed effects model. *p<0.05, **p<0.01, ***p<0.001, ns p>0.05. n indicates the number of animals. |