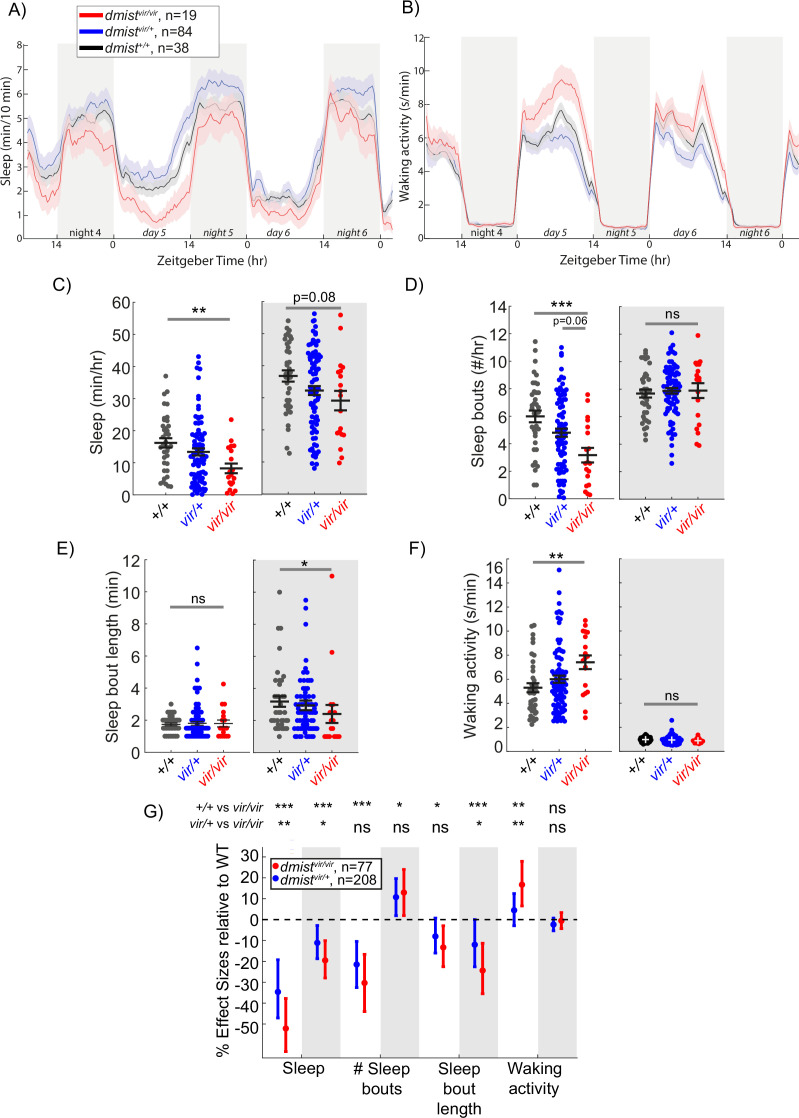
Figure 1 A viral insertion mini-screen identifies a short-sleeping mutant, dreammist. (A, B) Mean ± SEM sleep (A) and waking activity (B) of progeny from dmistvir/+ in-cross from original screen. White blocks show day (lights on) and grey blocks show night (lights off). Data is combined from two independent experiments. n indicates the number of animals. (C?F) Analysis of sleep/wake architecture for the data shown in (A, B). (C) Quantification of total sleep across 2 d and nights shows decreased day and night sleep in dmistvir/vir. Analysis of sleep architecture reveals fewer sleep bouts during the day (D) and shorter sleep bouts at night (E) in dmistvir/vir compared with sibling controls. (F) Daytime waking activity is also increased in dmistvir/vir. The black lines show the mean ± SEM, except in (E), which labels the median ± SEM. *p<0.05, **p<0.01, ***p<0.001; ns p>0.05; one-way ANOVA, Tukey?s post hoc test. (G) Combining five independent experiments using a linear mixed effects model with genotype as a fixed effect and experiment as a random effect reveals dmistvir/vir larvae have decreased total sleep and changes to sleep architecture during both the day and night compared to dmist+/+ siblings. Plotted are the genotype effect sizes (95% confidence interval) for each parameter relative to wild type. Shading indicates day (white) and night (grey). p-Values are assigned by an F-test on the fixed effects coefficients from the linear mixed effects model. *p<0.05, **p<0.01, ***p<0.001, ns p>0.05. n indicates the number of animals.
Image
Figure Caption
Acknowledgments
This image is the copyrighted work of the attributed author or publisher, and
ZFIN has permission only to display this image to its users.
Additional permissions should be obtained from the applicable author or publisher of the image.
Full text @ Elife

