|
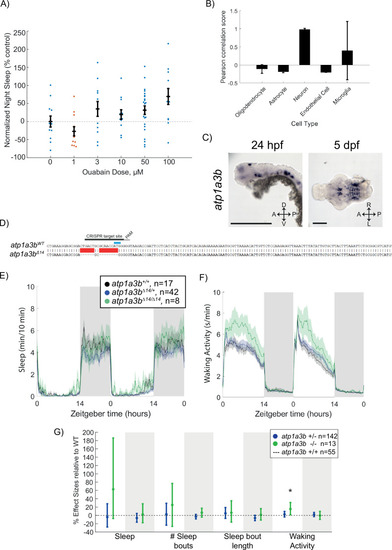
Ouabain dose curve and effects of atp1a3b mutation on behaviour (A) Dose–response curve of ouabain’s effects on sleep at night, shown as mean ± SEM and normalised to the DMSO control. Each data point represents a single fish. (B) Pearson rank correlation of canonical cell-type markers with Atp1a3a_Mm shows high co-expression with neuronal markers compared to astroglial and endothelial cell markers. Data are mean ± SEM. (C) In situ hybridisation of atp1a3a at 24 hpf (whole animal) and 5 dpf brain (ventral view). Anterior is to the left. Scale bar = 0.5 mm (24 hpf); 0.1 mm (5 dpf). (D) CRISPR-Cas9 targeting of atp1a3b resulted in a 14 bp deletion that eliminates the start codon (blue). Guide RNA target sequence and PAM sequence are shown as black bars. The sequence that is deleted in the mutant is indicated with a red bar. (E, F) Representative single behavioural experiment showing atp1a3bΔ14/Δ14 mutants have increased daytime waking activity but normal sleep patterns. (G) Data from two independent experiments combined with a linear mixed effects model. Plotted are the genotype effect sizes (95% confidence interval) for each parameter relative to wild type (dotted line) for each genotype. Shading indicates day (white) and night (grey). n indicates the number of animals. p-Values are assigned by an F-test on the fixed effects coefficients from the linear mixed effects model relative to atp1a3b+/+ animals. *p<0.05.
|