|
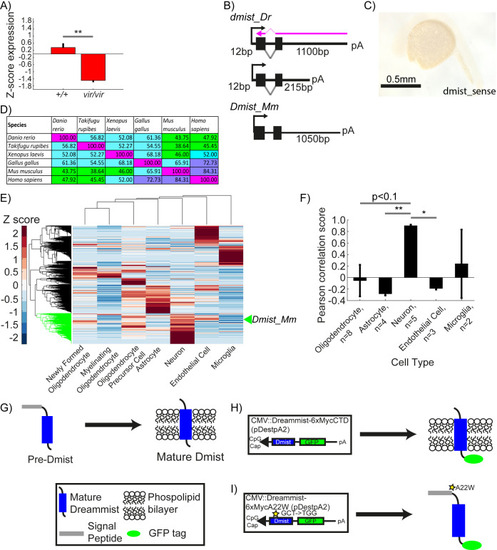
dmist is enriched in neurons and requires the signal peptide cleavage site for membrane localisation. (A) Relative expression level of dmist transcript from RNA sequencing of 6 dpf dmistvir/vir and dmist+/+ siblings. Z-scores were calculated by subtracting mean expression and normalising by the standard deviation across all expressed transcripts (27,243 transcripts). Data show mean ± SEM from three independent biological replicates. **p<0.01 Student’s t-test. (B) 3′ and 5′ RACE identify a long (1100 bp) and short (215 bp) 3′UTR variant in dmist_Dr, and a long 3′UTR (1050 bp) in Dmist_Mm. The purple arrow indicates the ISH probe used in Figure 2D. (C) dmist_Dr sense probe negative control at 24 hpf shows no detectable expression. (D) Percentage identity matrix comparing Dmist homologues across six vertebrate species (100% = magenta; >70% = purple; >50% = cyan; <50% = green). (E) Hierarchical clustering of RNAseq dataset of six different cell types isolated from the developing (E13.5) mouse brain (Zhang et al., 2014) and post hoc identification of Dmist_Mm. Data was standardised by subtracting the mean expression and normalising by the standard deviation across all expressed transcripts in each cell type (column). Dmist_Mm (green arrow) co-clusters with genes highly expressed in neurons (green shaded branches).(F) Pearson rank correlation of canonical cell-type markers with Dmist_Mm shows high co-expression with neuronal markers compared to astroglial and endothelial cell markers. Data are mean ± SEM. *p<0.05, **p<0.01; Kruskal–Wallis, Dunn–Sidak post hoc test. (G–I) Predicted processing of Dmist to its mature form in the plasma membrane (G). C-terminal GFP fusion to Dmist is predicted to localise to the membrane (H). However, a mutation (A22W) at the signal peptide cleavage site (I) is predicted to inhibit signal peptide cleavage and so prevent proper subcellular localisation of the mature protein.
|