
Fig. 9
- ID
- ZDB-FIG-230122-12
- Publication
- Gong et al., 2023 - Hyperaminoacidemia induces pancreatic α cell proliferation via synergism between the mTORC1 and CaSR-Gq signaling pathways
- Other Figures
- All Figure Page
- Back to All Figure Page
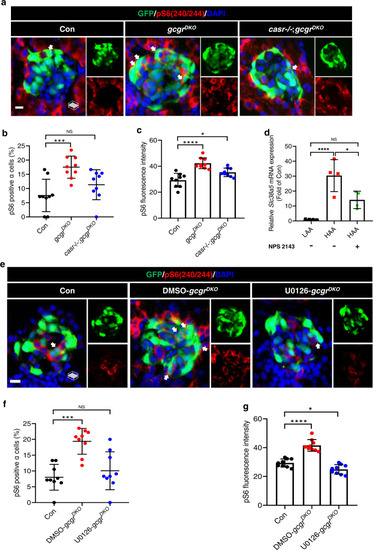
Hyperaminoacidemia-induced mTORC1 activation in ? cells requires CaSR and Mek1/2.
a Representative images of pS6(240/244) and GFP immunofluorescence in islet sections of control, gcgrDKO and casr?/?;gcgrDKO larvae at 5 dpf. The pS6(240/244) signal in ? cells is indicated by arrows, primary antibody: Anti-pS6 (Ser240/244) (1:300, rabbit); secondary antibody: Alexa Fluor 568 (1:1000, goat anti-rabbit) (scale bar, 7 ?m). b Quantification of the percentage of pS6(240/244) positive ? cells in control, gcgrDKO, and casr?/?;gcgrDKO larvae at 5 dpf (data represent the means � SD, n = 9 for each group). c Quantification of the pS6(240/244) fluorescence intensity in ? cells of control, gcgrDKO and casr?/?;gcgrDKO larvae at 5 dpf (data represent the means � SD, n = 9 for each group). d qPCR analysis of Slc38a5 in mouse islets cultured in LAA and HAA media with or without 0.5 �M NPS 2143 for 4 days. (data represent the means � SD, n = 4 for each group). e Representative images of pS6(240/244) and GFP immunofluorescence in islet sections of control and gcgrDKO larvae treated with 10 ?M U0126 or vehicle for 48 h at 5 dpf. The pS6(240/244) signal in ? cells is indicated by arrows, primary antibody: Anti-pS6 (Ser240/244) (1:300, rabbit); secondary antibody: Alexa Fluor 568 (1:1000, goat anti-rabbit) (scale bar, 7 ?m). f Quantification of the percentage of pS6(240/244) positive ? cells in control and gcgrDKO larvae treated with 10 ?M U0126 or vehicle for 48 h at 5 dpf (data represent the means � SD, n = 9 for each group). g Quantification of the pS6(240/244) fluorescence intensity in ? cells of control and gcgrDKO larvae treated with 10 ?M U0126 or vehicle for 48 h at 5 dpf (data represent the means � SD, n = 9 for each group). *P < 0.05, ***P < 0.001, ****P < 0.0001, NS indicates no significant difference (one-way ANOVA, Tukey?s multiple comparisons test, the quantifications represent individual islet sections). Source data are provided as a Source Data file. |