
Fig. 7
- ID
- ZDB-FIG-230115-64
- Publication
- Brandt et al., 2021 - Ablation of mpeg+ Macrophages Exacerbates mfrp-Related Hyperopia
- Other Figures
- All Figure Page
- Back to All Figure Page
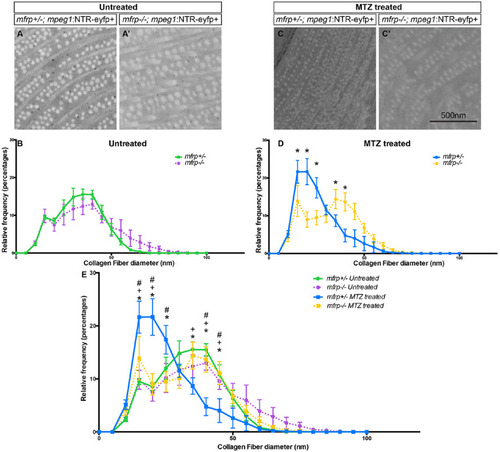
Collagen fibril diameter in mfrp+/– and mfrp–/– sclera with and without macrophage ablation. Representative examples of collagen fibrils in the central posterior sclera of mfrp+/–; mpeg1:NTR-eYFP+ (A) and mfrp–/–; mpeg1:NTR-eYFP+ (A') untreated fish. (B) Frequency distribution of collagen fiber diameter with y-axis = relative frequency as a percentage and x-axis = collagen fiber diameter in 5-nm bins. mfrp+/– is indicated by a green line, mfrp–/– by a purple line. For mfrp+/–, n = 3; for mfrp–/–, n = 4. (C) Representative examples of collagen fibrils in the central posterior sclera of mfrp+/–; mpeg1:NTR-eYFP+ (C) and mfrp–/–; mpeg1:NTR-eYFP+ (C') MTZ treated fish. (D) Frequency distribution of collagen fiber diameter with y-axis = relative frequency as a percentage and x-axis = collagen fiber diameter in 5-nm bins. mfrp+/– is represented by a blue line, mfrp–/– by a yellow line. For mfrp+/–, n = 5; for mfrp–/–, n = 5. Multiple t-tests were used for statistical analysis. *P < 0.001. (E) Combined graph of (B) and (D). Errors bars represent standard deviations throughout figure. Two-way ANOVA with Tukey's multiple-comparisons were used for statistical analysis. An asterisk (*) denotes a significant difference between mfrp+/– MTZ treated and mfrp–/– MTZ treated; a plus sign (+) denotes a significant difference between mfrp+/– MTZ treated and mfrp+/– untreated; and the pound symbol (#) denotes a significant difference between mfrp+/– MTZ treated and mfrp–/– untreated. P < 0.05 for all significant differences in (E). |
| Fish: | |
|---|---|
| Condition: | |
| Observed In: | |
| Stage: | Days 45-89 |