
|
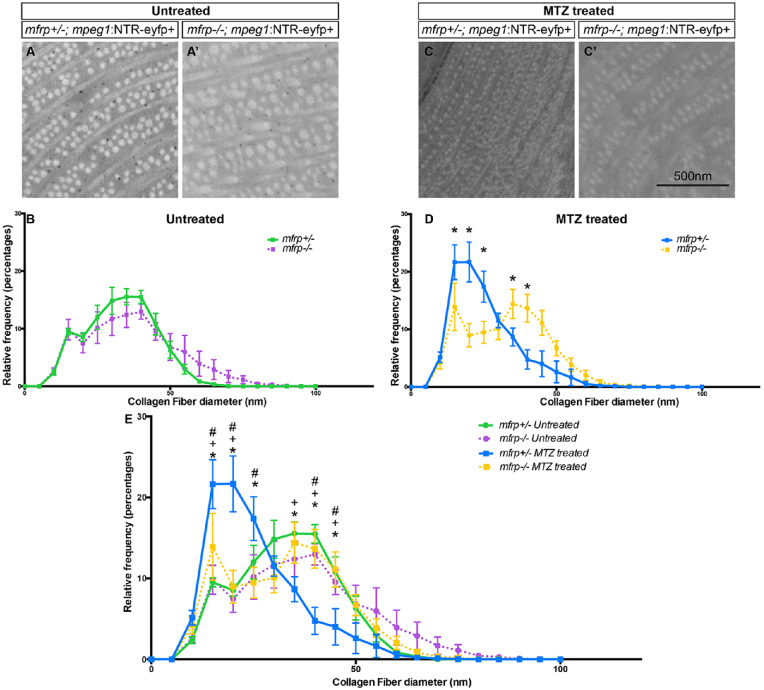
Fig. 7
Collagen fibril diameter in mfrp+/? and mfrp?/? sclera with and without macrophage ablation. Representative examples of collagen fibrils in the central posterior sclera of mfrp+/?; mpeg1:NTR-eYFP+ (A) and mfrp?/?; mpeg1:NTR-eYFP+ (A') untreated fish. (B) Frequency distribution of collagen fiber diameter with y-axis = relative frequency as a percentage and x-axis = collagen fiber diameter in 5-nm bins. mfrp+/? is indicated by a green line, mfrp?/? by a purple line. For mfrp+/?, n = 3; for mfrp?/?, n = 4. (C) Representative examples of collagen fibrils in the central posterior sclera of mfrp+/?; mpeg1:NTR-eYFP+ (C) and mfrp?/?; mpeg1:NTR-eYFP+ (C') MTZ treated fish. (D) Frequency distribution of collagen fiber diameter with y-axis = relative frequency as a percentage and x-axis = collagen fiber diameter in 5-nm bins. mfrp+/? is represented by a blue line, mfrp?/? by a yellow line. For mfrp+/?, n = 5; for mfrp?/?, n = 5. Multiple t-tests were used for statistical analysis. *P < 0.001. (E) Combined graph of (B) and (D). Errors bars represent standard deviations throughout figure. Two-way ANOVA with Tukey's multiple-comparisons were used for statistical analysis. An asterisk (*) denotes a significant difference between mfrp+/? MTZ treated and mfrp?/? MTZ treated; a plus sign (+) denotes a significant difference between mfrp+/? MTZ treated and mfrp+/? untreated; and the pound symbol (#) denotes a significant difference between mfrp+/? MTZ treated and mfrp?/? untreated. P < 0.05 for all significant differences in (E).