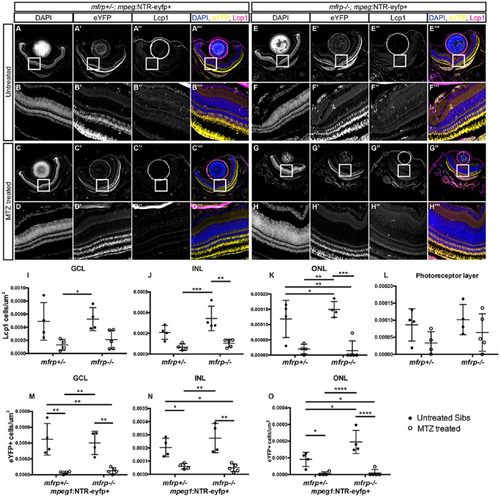
Distribution of macrophage accumulation and ablation across mfrp+/?; and mfrp?/? retinae. (A?H) Representative images of central retina sections from mfrp+/?; mpeg1:NTR-eYFP+ and mfrp?/?; mpeg1:NTR-eYFP+ MTZ treated and untreated fish. (A?H) Grayscale DAPI images at low magnification (A, C, E, G) and high magnification (B, D, F, H). (A'?H') Grayscale eYFP images at low magnification (A', C', E', G') and high magnification (B', D', F', H'). (A''?H'') Grayscale Lcp1 images at low magnification (A'', C'', E'', G'') and high magnification (B'', D'', F'', H''). Colorized merged images with DAPI are shown in blue, eYFP in yellow, and Lcp1 in magenta; images are at low magnification (A''', C''', E''', G''') and high magnification (B''', D''', F''', H'''). (I?L) Quantification of the number of Lcp1+ cells per �m2 in the ganglion cell layer (I) and inner (J) and outer (K) nuclear layer, and photoreceptor layer (L). (M?O) Quantification of the number of eYFP+ cells per �m2 in the ganglion cell layer (M) and inner (N) and outer (O) nuclear layer. Error bars represent standard deviations. Two-way ANOVA was used for statistical analysis for (I) to (O). P values are shown from Tukey's multiple comparisons for post hoc analysis. *P < 0.05, **P < 0.01, ***P < 0.001, ****P < 0.0001. For mfrp+/? untreated, n = 4; for mfrp+/? MTZ treated, n = 4; for mfrp?/? untreated, n = 4; for mfr?/? MTZ treated, n = 5.