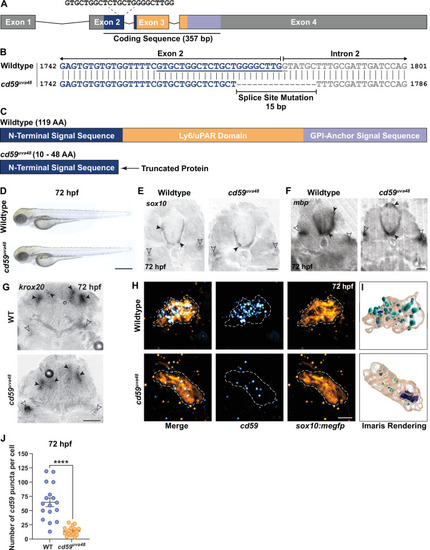
(A) Schematic of zebrafish cd59 gene. The cd59 coding sequence (357 bp; CDS) encodes the protein domains with the corresponding colors indicated in (C). The non-CDS is indicated in gray. The dashed lines indicate the sgRNA and the target sequence. (B) Genomic sequences for wildtype cd59 and mutant cd59uva48 showing a 15 bp deletion at the splice site between exon 2 (blue) and intron 2 (gray) of the cd59 gene. (C) Schematic of Cd59 protein made in wildtype (119 AA; top panel) and cd59uva48 mutant fish (10?48 AA; bottom panel). (D) Bright-field images of wildtype and cd59uva48 mutant larvae at 72 hours post fertilization (hpf) showing no anatomical defects as a result of cd59 mutation. (E) Chromogenic in situ hybridization (CISH) showing sox10-positive (gray) oligodendrocytes (OLs) in the spinal cord (filled arrows) and Schwann cells (SCs) on the posterior lateral line nerve (pLLN) (empty arrows) at 72 hpf in transverse sections. (F) CISH showing mbp-positive (gray) OLs in the spinal cord (filled arrows) and SCs on the pLLN (empty arrows) at 72 hpf in transverse sections. (G) CISH showing krox20-positive (gray) SCs on the pLLN (empty arrows) and neurons in the brain (filled arrows) at 72 hpf in transverse sections. (H) Fluorescent in situ hybridization (FISH) (RNAscope; ACD) showing cd59 expression (cyan) in sox10:megfp-positive SCs (orange) along the pLLN at 72 hpf. Representative images each display a transverse section (z projection of 20 Ám) of single SC on the pLLN. (I) Imaris renderings show cd59 puncta that are localized within each SC. (J) Scatter plot of the number of cd59 RNA puncta in pLLN SCs (mean ▒ SEM: WT: 64.7 ▒ 7.6, cd59uva48: 14 ▒ 1.7; p<0.0001; dot = 1 cell; n = 7 fish per group). These data were compared with Student?s t-test using GraphPad Prism. CISH and FISH images were acquired with confocal imaging. Scale bars: (A) 0.25 mm; (E, F) 25 Ám; (G) 50 Ám. Artwork created by Ashtyn T. Wiltbank with Illustrator (Adobe).
|

