- Title
-
Cd59 and inflammation regulate Schwann cell development
- Authors
- Wiltbank, A.T., Steisnon, E.R., Criswell, S.J., Piller, M., Kucenas, S.
- Source
- Full text @ Elife
|
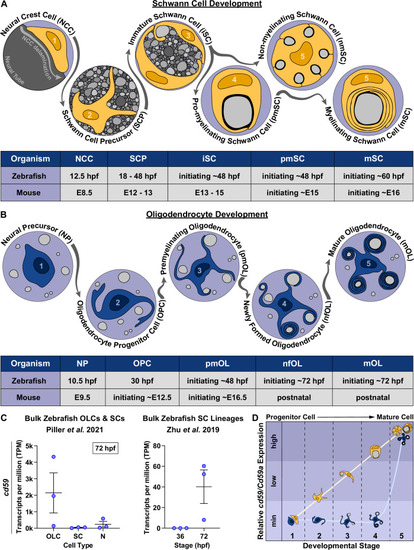
cd59 is expressed in myelinating glial cells during nervous system development. (A) Timeline of Schwann cell (SC) (orange) development (top panel). SC developmental stages for zebrafish (hours post fertilization [hpf]) and mice (embryonic day [E]) are indicated in the bottom panel. (B) Timeline of oligodendrocyte (OL) (blue) development. OL developmental stages for zebrafish (hpf) and mice (E and postnatal day) are indicated in the bottom panel. (C) Scatter plot of cd59 expression (TPM) in oligodendrocyte lineage cells (OLCs), SCs, and neurons (N) at 72 hpf (left; mean ▒ SEM: OLC: 2145.1 ▒ 1215.1; SC: 40.1 ▒ 16.3; N: 240.5 ▒ 173.3; dot = replicate) as well as SCs at 36 and 72 hpf (right; mean ▒ SEM: 36 hpf: 0.0 ▒ 0.0, 72 hpf: 40.2 ▒ 16.3; dot = replicate). (D) Schematic of the relative cd59/Cd59a expression in developing SCs (orange) and OLs (blue) determined from RNAseq analysis in Figure 1?figure supplement 1. Developmental stage numbers correspond with stages indicated in (A) and (B). Artwork created by Ashtyn T. Wiltbank with Illustrator (Adobe) based on previous schematics and electron micrographs published in Ackerman and Monk, 2016; Cunningham and Monk, 2018; Jessen and Mirsky, 2005. |
|
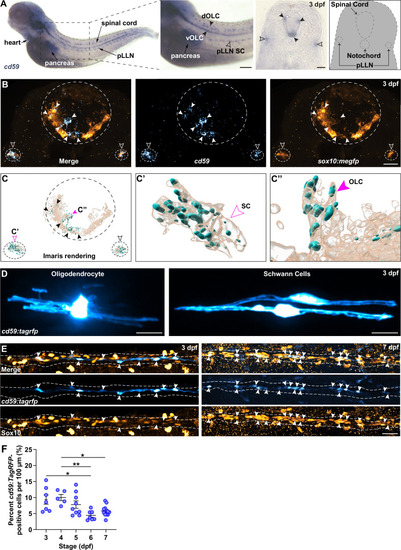
cd59 is expressed in Schwann cells (SCs) and oligodendrocytes (OLs). (A) Bright-field images of whole-mount chromogenic in situ hybridization (CISH) showing cd59 expression (purple) in the heart, pancreas, dorsal and ventral oligodendrocyte lineage cells (OLCs) (dOLCs and vOLCs, respectively; filled arrows), and posterior lateral line nerve (pLLN) SCs (empty arrows) at 3 days post fertilization (dpf). Schematic (right panel) indicates location of spinal cord, notochord, and pLLN in transverse section. (B) Fluorescent in situ hybridization (FISH) (RNAscope; ACD) showing cd59 expression (cyan) in sox10:megfp-positive, pLLN SCs (cd59-positive orange cells indicated by empty arrows), and spinal cord OLs (cd59-positive orange cells indicated by filled arrows) at 3 dpf in transverse sections (top row). Representative image (top row) displays one SC on each pLLN (left and right empty arrows) as well as multiple OLs in the spinal cord (filled arrows). Images were acquired with confocal imaging. (C) Imaris renderings of the confocal images shown in (B), including the full image (left panel). From the full image (left panel, C), a single SC (indicated with the open magenta arrow and enlarged in the middle panel, C?) and a single OLC (indicated with the filled magenta arrow and enlarged in the right panel, C??) illustrate the cd59 puncta localized within the myelinating cells. (D) Mosaic labeling showing a cd59:tagrfp-positive OL in the spinal cord (left) and two SCs on the pLLN (right) at 3 dpf. (E) Immunofluorescence (IF) showing cd59:tagrfp expression (cyan) in Sox10-positive SCs (orange) along the pLLN at 3 and 7 dpf (left and right panels, respectively). Double-positive cells are indicated with white arrows. White dashed lines outline the pLLN. Sox10-positive pigment cells outside of the dashed lines were not included in the analysis. (F) Scatter plot of percent cd59:tagrfp-positive SCs on the pLLN from 3 to 7 dpf (mean ▒ SEM: 3 dpf: 9.4 ▒ 1.5; 4 dpf: 10.0 ▒ 1.0; 5 dpf: 7.8 ▒ 1.2; 6 dpf: 4.4 ▒ 0.6; 7 dpf: 5.8▒ 0 .6; p-values: 3 vs. 6 dpf: p=0.0126, 4 vs. 6 dpf: p=0.0095, 4 vs. 7 dpf: Pp0.0477; dot = 1 fish). Data collected from somites 11?13 (~320 Ám) and normalized to units per 100 Ám. These data were compared with a one-way ANOVA with Tukey?s post-hoc test using GraphPad Prism. All fluorescent images were acquired with confocal imaging. Scale bars: (A) lateral view, 100 Ám; transverse section, 25 Ám; (B, D) 10 Ám; (E) 25 Ám. Artwork created by Ashtyn T. Wiltbank with Illustrator (Adobe).
EXPRESSION / LABELING:
|
|
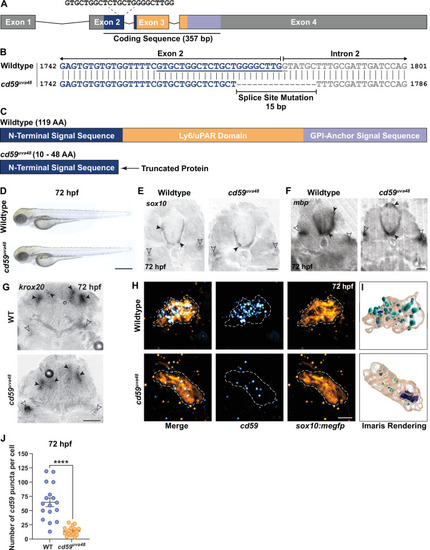
(A) Schematic of zebrafish cd59 gene. The cd59 coding sequence (357 bp; CDS) encodes the protein domains with the corresponding colors indicated in (C). The non-CDS is indicated in gray. The dashed lines indicate the sgRNA and the target sequence. (B) Genomic sequences for wildtype cd59 and mutant cd59uva48 showing a 15 bp deletion at the splice site between exon 2 (blue) and intron 2 (gray) of the cd59 gene. (C) Schematic of Cd59 protein made in wildtype (119 AA; top panel) and cd59uva48 mutant fish (10?48 AA; bottom panel). (D) Bright-field images of wildtype and cd59uva48 mutant larvae at 72 hours post fertilization (hpf) showing no anatomical defects as a result of cd59 mutation. (E) Chromogenic in situ hybridization (CISH) showing sox10-positive (gray) oligodendrocytes (OLs) in the spinal cord (filled arrows) and Schwann cells (SCs) on the posterior lateral line nerve (pLLN) (empty arrows) at 72 hpf in transverse sections. (F) CISH showing mbp-positive (gray) OLs in the spinal cord (filled arrows) and SCs on the pLLN (empty arrows) at 72 hpf in transverse sections. (G) CISH showing krox20-positive (gray) SCs on the pLLN (empty arrows) and neurons in the brain (filled arrows) at 72 hpf in transverse sections. (H) Fluorescent in situ hybridization (FISH) (RNAscope; ACD) showing cd59 expression (cyan) in sox10:megfp-positive SCs (orange) along the pLLN at 72 hpf. Representative images each display a transverse section (z projection of 20 Ám) of single SC on the pLLN. (I) Imaris renderings show cd59 puncta that are localized within each SC. (J) Scatter plot of the number of cd59 RNA puncta in pLLN SCs (mean ▒ SEM: WT: 64.7 ▒ 7.6, cd59uva48: 14 ▒ 1.7; p<0.0001; dot = 1 cell; n = 7 fish per group). These data were compared with Student?s t-test using GraphPad Prism. CISH and FISH images were acquired with confocal imaging. Scale bars: (A) 0.25 mm; (E, F) 25 Ám; (G) 50 Ám. Artwork created by Ashtyn T. Wiltbank with Illustrator (Adobe). EXPRESSION / LABELING:
PHENOTYPE:
|
|
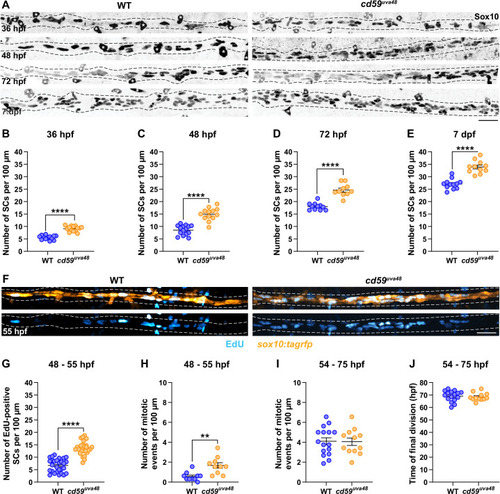
(A) Immunofluorescence (IF) showing Sox10-positive SCs (black/gray) along the posterior lateral line nerve (pLLN) from 36 hours post fertilization (hpf) to 7 days post fertilization (dpf). Black dashed lines outline the pLLN. Sox10-positive pigment cells outside of the dashed lines (white asterisks) were not included in the analysis. (B?E) Scatter plots of the number of Sox10-positive SCs along the pLLN from 36 hpf to 7 dpf (mean ▒ SEM: 36 hpf: WT: 5.6 ▒ 0.2, cd59uva48: 9.1 ▒ 0.3; 48 hpf: WT: 8.6 ▒ 0.5, cd59uva48: 15.0 ▒ 0.7; 72 hpf: WT: 18.0 ▒ 0.4, cd59uva48: 24.3 ▒ 0.8; 7 dpf: WT: 27.0 ▒ 0.6, cd59uva48: 33.9 ▒ 0.8; p-values: p<0.0001; dot = 1 fish). (F) EdU incorporation assay showing sox10:tagrfp-positive, pLLN SCs (orange) pulsed with EdU (cyan) from 48 to 55 hpf. (G) Scatter plot of the number of EdU-positive SCs along the pLLN at 55 hpf (WT: 6.7 ▒ 0.5, cd59uva48: 13.6 ▒ 0.5; p<0.0001; dot = 1 fish). (H) Scatter plot of the number of mitotic events observed in SCs from 48 to 55 hpf (mean ▒ SEM: WT: 0.6 ▒ 0.1, cd59uva48: 1.7 ▒ 0.3; p=0.0019; dot = 1 fish). (I) Scatter plot of the number of mitotic events observed in SCs from 54 to 75 hpf (mean ▒ SEM: WT: 4.1 ▒ 0.3, cd59uva48: 4.1 ▒ 0.4; dot = 1 fish). (H) Scatter plot of the time of final cell division (hpf) observed in SCs from 54 to 75 hpf (mean ▒ SEM: WT: 69.1 ▒ 1.1, cd59uva48: 68.4 ▒ 0.9; dot = 1 fish). All data were collected from somites 11?13 (~320 Ám) and normalized to units per 100 Ám. All images in this figure were acquired with confocal imaging. Each dataset was compared with Student?s t-test using GraphPad Prism. Scale bars: (A, F) 25 Ám. |
|
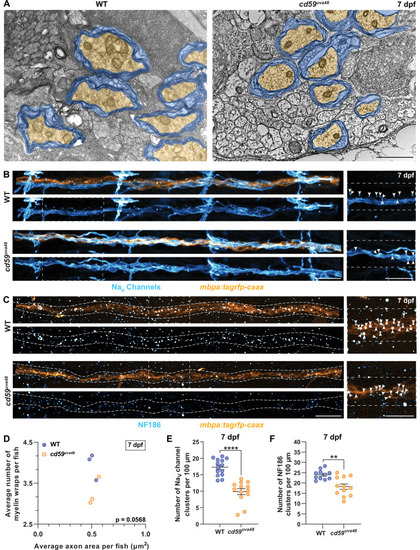
(A) Transmission electron micrographs showing posterior lateral line nerve (pLLN) axons myelinated by Schwann cells (SCs) at 7 days post fertilization (dpf). Myelin is shaded in blue, and myelinated axons are shaded in orange. (B) Immunofluorescence (IF) showing NaV channels (cyan) along mbpa:tagrfp-caax-positive pLLNs (orange) at 7 dpf. Diffuse NaV channel staining along unmyelinated nerves was not quantified. White dashed lines outline the pLLN. White dashed boxes correspond with the insets on the right. (C) IF showing NF186 clusters (cyan) along mbpa:tagrfp-caax-positive pLLNs (orange) at 7 dpf. White dashed lines outline the pLLN, and the white dashed boxes correspond to the insets on the right. Representative images in (B) and (C) depict somites 11?13 (~320 Ám). (D) Average number of myelin wrappings per pLLN axon plotted relative to the average area of axon cross-section at 7 dpf. Data were collected from three sections per fish separated by 100 Ám. Significance was determined by comparing the average number of myelin wraps divided by the average axon area for each fish with Student?s t-test using GraphPad Prism (average number of myelin wraps per fish mean ▒ SEM: WT: 3.95 ▒ 0.19, cd59uva48: 3.27 ▒ 0.20; average axon area per fish mean ▒ SEM: WT: 0.51 ▒ 0.03, cd59uva48: 0.52 ▒ 0.03; average number of myelin wraps/average axon area per fish mean ▒ SEM: WT: 0.13 ▒ 0.01, cd59uva48: 0.16 ▒ 0.002; p=0.0568; dot = 1 fish). Data quantified in (D) were determined from electron micrographs in (A). (E) Scatter plot of the number of NaV channel clusters along mbpa:tagrfp-positive pLLN nerves at 7 dpf (mean ▒ SEM: WT: 17.3 ▒ 0.7, cd59uva48: 9.9 ▒ 0.9; p<0.0001; dot = 1 fish). (F) Scatter plot of the number of NF186 clusters along mbpa:tagrfp-positive pLLN nerves at 7 dpf (mean ▒ SEM: WT: 24.0 ▒ 0.7, cd59uva48: 18.2 ▒ 1.3; p=0.0011; dot = 1 fish). Data were collected from somites 3?13 (~320 Ám) and normalized to units per 100 Ám for (E) and (F). Images shown in (A) were acquired with transmission electron microscopy. Images shown in (B) and (C) were acquired with confocal imaging. Each dataset was compared with Student?s t-test using GraphPad Prism. Scale bars: (A) 1 Ám; (B, C) 25 Ám. |
|
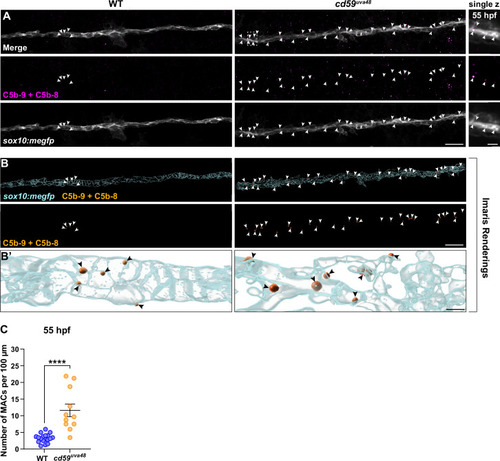
(A) Top panel: immunofluorescence (IF) showing MACs (C5b-9+C5b-8; magenta, indicated with white arrows) embedded in sox10:megfp-positive posterior lateral line nerve (pLLN) SC membranes (gray) at 55 hours post fertilization (hpf). White dotted box corresponds with inset of a single z-plane on the right showing that MACs are within SC membranes. (B) Imaris renderings showing MACs (C5b-9+C5b-8; orange, indicated with white arrows) embedded in sox10:megfp-positive pLLN SC membranes (cyan) at 55 hpf. (B?) Enlarged renderings show MAC puncta (orange, indicated with black arrows) embedded in the SC membranes (cyan). (C) Scatter plot of the number of MACs in SC membranes at 55 hpf (mean ▒ SEM: WT: 3.3 ▒ 0.3, cd59uva48: 11.6 ▒ 1.9; p<0.0001; dot = 1 fish). These data were compared with Student?s t-test using GraphPad Prism. All data were normalized to units per 100 Ám. All images were acquired with confocal imaging. Scale bars: (A, B) 10 Ám; inset (A) and enlarged renderings (B?), 5 Ám. |
|
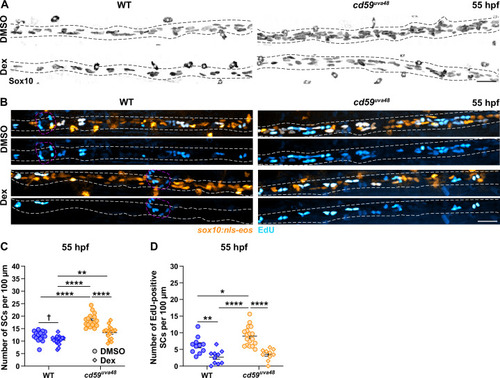
(A) Immunofluorescence (IF) showing Sox10-positive posterior lateral line nerve (pLLN) SCs (black/gray) at 55 hours post fertilization (hpf) in embryos treated with DMSO or 100 ÁM dexamethasone (Dex). Black dashed lines outline the pLLN. Sox10-positive pigment cells outside of the dashed lines (white asterisks) were not included in the analysis. (B) EdU incorporation assay showing sox10:nls-eos-positive, pLLN SCs (orange) pulsed with EdU (cyan) from 48 to 55 hpf in embryos treated with DMSO or 100 ÁM Dex. White dashed lines outline the pLLN. Magenta dashed lines outline neuromasts. (C) Scatter plot of the number of pLLN SCs at 55 hpf. Asterisks (*) indicate significant differences discovered with two-way ANOVA with Tukey?s post-hoc test using GraphPad Prism. Obelisk (?) indicates the significant difference discovered with Student?s t-test (GraphPad Prism) comparing WT DMSO and WT Dex alone (mean ▒ SEM: DMSO: WT: 12.0 ▒ 0.5, cd59uva48: 18.1 ▒ 0.6; Dex: WT: 10.4 ▒ 0.4, cd59uva48: 13.4 ▒ 0.6; two-way ANOVA p-values: WT DMSO vs. cd59uva48 DMSO: p<0.0001, WT Dex vs. cd59uva48 DMSO: p<0.0001, WT Dex vs. cd59uva48 Dex: p=0.0014, cd59uva48 DMSO vs. cd59uva48 Dex: p<0.0001; t-test p-value (compared WT only): WT DMSO vs. WT Dex: p=0.0206; dot = 1 fish). (D) Scatter plot of the number of EdU-positive SCs along the pLLN at 55 hpf in embryos treated with DMSO or 100 ÁM Dex (mean ▒ SEM: DMSO: WT: 4.6 ▒ 0.85, cd59uva48: 9.0 ▒ 0.68; Dex: WT: 2.7 ▒ 0.65, cd59uva48: 3.5 ▒ 0.53; p-values: WT DMSO vs. WT Dex: p=0.0091, WT DMSO vs. cd59uva48 DMSO: p=0.0266, WT Dex vs. cd59uva48 DMSO: p<0.0001, cd59uva48 DMSO vs. cd59uva48 Dex: p<0.0001; dot = 1 fish). These data were compared with Student?s t-test using GraphPad Prism. All data were normalized to units per 100 Ám. All images were acquired with confocal imaging. Scale bars: (A, B) 25 Ám. |
|
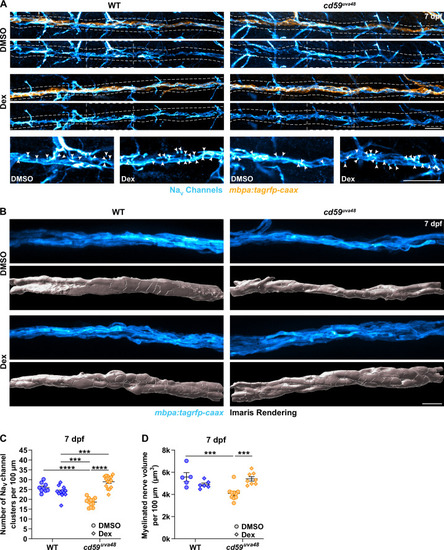
(A) Immunofluorescence (IF) showing NaV channels (cyan) along mbpa:tagrfp-caax-positive nerves (orange) at 7 days post fertilization (dpf) in larvae treated with DMSO or 100 ÁM dexamethasone (Dex). Diffuse NaV channel staining along unmyelinated nerves was not quantified. White dashed lines outline the posterior lateral line nerve (pLLN). White dashed boxes correspond with the insets below. Representative images are from somite 11?13 (~320 Ám). (B) In vivo imaging showing the volume of mbpa:tagrfp-caax-positive nerves at 7 dpf in larvae treated with DMSO or 100 ÁM Dex. Bottom panels depict Imaris renderings (white) of myelinated nerve volumes. Representative images are from somite 12 (~110 Ám). (C) Scatter plot of the number of NaV channel clusters along mbpa:tagrfp-caax-positive nerves at 7 dpf (mean ▒ SEM: DMSO: WT: 26.0 ▒ 0.8, cd59uva48: 18.6 ▒ 0.6; Dex: WT: 23.9 ▒ 0.8, cd59uva48: 28.9 ▒ 0.8; p-values: WT DMSO vs. cd59uva48 DMSO: p<0.0001, WT Dex vs. cd59uva48 DMSO: p=0.0001, WT Dex vs. cd59uva48 Dex: p=0.0001, cd59uva48 DMSO vs. cd59uva48 Dex: p<0.0001; dot = 1 fish). These data were compared with a two-way ANOVA with Tukey?s post-hoc test using GraphPad Prism. Data were collected from somites 3?13 (~320 Ám). (D) Scatter plot of myelinated nerve volumes at 7 dpf (mean ▒ SEM: DMSO: WT: 5.6 ▒ 0.4, cd59uva48: 4.1 ▒ 0.2; Dex: WT: 4.9 ▒ 0.1, cd59uva48: 5.4 ▒ 0.2; p--values: WT DMSO vs. cd59uva48 DMSO: p=0.0009, cd59uva48 DMSO vs. cd59uva48 Dex: p=0.0006; dot = 1 fish). These data were compared with a two-way ANOVA with Tukey?s post-hoc test using GraphPad Prism. Data were collected from somite 12 (~110 Ám). All data were normalized to units per 100 Ám. All images were acquired with confocal imaging. Scale bars: (A) 25 Ám; inset, 25 Ám; (B) 10 Ám. |

