Fig. 1
- ID
- ZDB-FIG-220628-40
- Publication
- Wiltbank et al., 2022 - Cd59 and inflammation regulate Schwann cell development
- Other Figures
- All Figure Page
- Back to All Figure Page
|
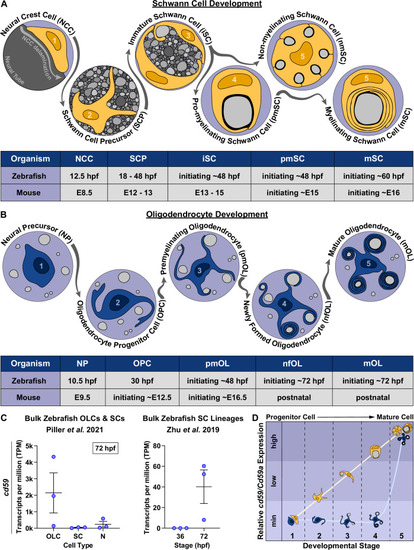
cd59 is expressed in myelinating glial cells during nervous system development. (A) Timeline of Schwann cell (SC) (orange) development (top panel). SC developmental stages for zebrafish (hours post fertilization [hpf]) and mice (embryonic day [E]) are indicated in the bottom panel. (B) Timeline of oligodendrocyte (OL) (blue) development. OL developmental stages for zebrafish (hpf) and mice (E and postnatal day) are indicated in the bottom panel. (C) Scatter plot of cd59 expression (TPM) in oligodendrocyte lineage cells (OLCs), SCs, and neurons (N) at 72 hpf (left; mean ± SEM: OLC: 2145.1 ± 1215.1; SC: 40.1 ± 16.3; N: 240.5 ± 173.3; dot = replicate) as well as SCs at 36 and 72 hpf (right; mean ± SEM: 36 hpf: 0.0 ± 0.0, 72 hpf: 40.2 ± 16.3; dot = replicate). (D) Schematic of the relative cd59/Cd59a expression in developing SCs (orange) and OLs (blue) determined from RNAseq analysis in Figure 1?figure supplement 1. Developmental stage numbers correspond with stages indicated in (A) and (B). Artwork created by Ashtyn T. Wiltbank with Illustrator (Adobe) based on previous schematics and electron micrographs published in Ackerman and Monk, 2016; Cunningham and Monk, 2018; Jessen and Mirsky, 2005. |

