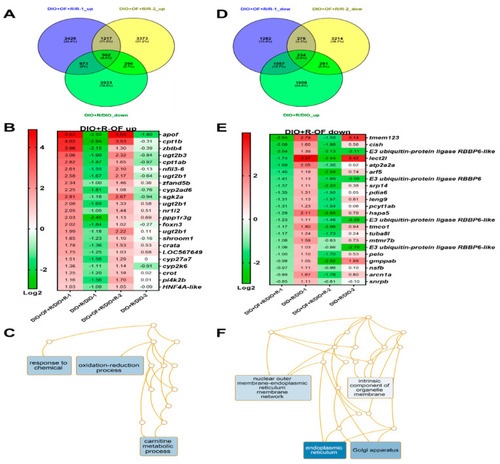
GeneTitan array analysis of the expression profile of HCC transgenic zebrafish following different treatments. (A) Venn diagram of upregulation of genes in HCC transgenic zebrafish diet-induced obesity with irradiation and Oligo-Fucoidan pretreatment (DIO + OF + R) compared to irradiation only (DIO + R), overlapping with downregulated in irradiation (DIO + R) compared to no radiation (DIO). (B) The heatmap of genes upregulated in Oligo-Fucoidan pretreatment but downregulated by irradiation. First batch is HBx, src transgenic fish with 40 Gy (1), and second batch is HBx, src, p53-transgenic fish with 10 Gy (2). (C) Gene ontology analysis of Oligo-Fucoidan induced genes in irradiated transgenic fish. (D) Venn diagram of downregulation of genes in HCC transgenic zebrafish diet-induced obesity with irradiation and Oligo-Fucoidan pretreatment (DIO + OF +R) compared to irradiation only (DIO + R), overlapping with downregulated in irradiation (DIO + R) compare to no radiation (DIO). (E) The heatmap of genes downregulated in Oligo-Fucoidan pretreatment but upregulated by irradiation. First batch is HBx, src transgenic fish with 40 Gy (1), and second batch is HBx, src, p53-transgenic fish with 10 Gy (2). (F) Gene ontology analysis of Oligo-Fucoidan repressed genes in irradiated transgenic fish.
|
