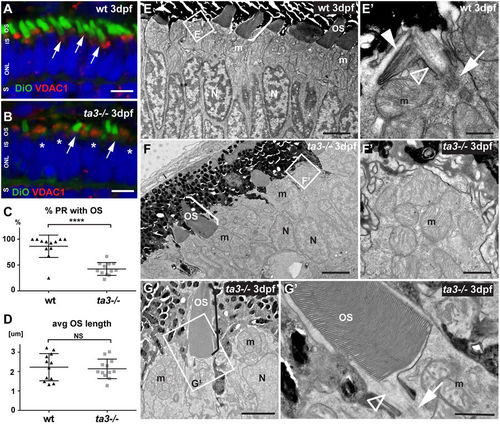
Deficient OS development in ta3−/− larvae in the majority of PRs. (A,B) 3 dpf cryosections stained with DiO to mark the OS (green, arrows) and with VDAC1 to mark mitochondrial clusters show reduced numbers of OSs in ta3 mutants (B) compared to wildtype (wt) (A). Asterisks highlight PRs without OS in mutants. Nuclei are counterstained with DAPI (blue). (C) Quantification of the proportion of PRs with extended OSs in wt (black triangles) compared to ta3 mutants (grey squares) shows significantly reduced PRs with OSs in mutants (****p < 0.0001, t-test, n = 12 wt and 12 mutant larvae). Each data point represents the proportion of PRs with OSs on a single confocal section of a single larva. Bars are standard deviation. (D) Quantification of average OS length on cryosections shows no significant difference between 3 dpf wt and ta3 mutants (p = 0.7366, Student’s t-test, n = 12 wt and 12 mutant larvae). Each data point represents the average OS length on a single confocal section of a single larva. Error bars are standard deviation. (E–G’) Representative transmission electron microscopy images of 3 dpf wt (E–E’) and ta3 mutant (F–G’) retinae. (E–E’) The majority of wt PRs have extended OSs (bracket in E) or are starting to stack membranes to do so (white arrowhead in E’). Note the BB (arrow in E’) and the connecting cilium (empty arrowhead in E’) in wt photoreceptors. (F–F’) In contrast, in ta3−/− PRs, only a minority of PRs have extended OSs (bracket in F), and no attempt at membrane stacking is observed in the other PRs (F’). (G) Note the normal appearance of the OSs that have extended in the mutants, including the structurally normal connecting cilium (arrowhead in G’) and basal body (arrow in G’). avg average, dpf days post fertilization, IS inner segment, m mitochondria, N nuclei, NS not significant, ONL outer nuclear layer, OS outer segment, PR photoreceptor, S synapse, wt wild-type. Scale bars: 4 µm in (A,B), 3 µm in E and F, 0.5 µm in (E’), 2 µm in (G), 1 µm in (F’–G’).
|
