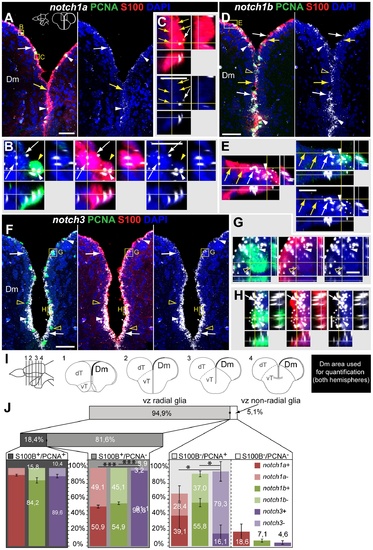
notch1a, notch1b and notch3 expression in radial glia and proliferating cells of the dorso-medial ventricular zone of the telencephalon. Confocal images showing localization of Notch receptors by FISH (white), radial glia labelled with S100β (red), and PCNA + proliferating cells (green); DAPI (blue) is used as nuclear counterstaining. Schematics in A indicate the cross-section levels through the telencephalon and the dorsal telencephalic area represented in the micrographs. A-C, notch1a and D-E, notch1b expressing cells are scattered throughout the dorso-medial ventricular zone of the dT and co-localize with both PCNA +/S100β + cells (filled arrowheads) and a subpopulation of PCNA -/S100β+ cells (white arrows); yellow arrows indicate Notch receptor -/PCNA -/S100β + cells; unfilled yellow arrowheads indicate notch1b - /PCNA + cells. F-H, notch3 expressing cells localize to a great extent with the S100β marker, including both PCNA (white arrows) and PCNA (white arrowheads) cells; unfilled yellow arrowheads indicate notch3 - /PCNA + cells. I, Schematics indicating the cross-sections levels through the telencephalon, along the rostro-caudal axis, and examples of Dm areas used for marker co-localization analysis in J. J, Quantification on the co-localization of Notch receptor by FISH with PCNA and S100β, for the Dm region; all ventricularly located cells of the indicated area were counted; cells were distinguished based on their glia character (S100β+ ), Notch receptor expression and proliferative status (PCNA +). n = 9 (fish), 4-6 tissue sections per fish, at the rostro-caudal levels indicated in I; total number of cells counted = 7245. Values represented as mean percentage SEM. Significance levels: p<0.00(***),p<0.05(*) . Abbreviations: Dm, dorso-medial telencephalic area; dT, dorsal telencephalic area; vT, ventral telencephalic area; Scale bars = 50 μmin A, in D and in F; 10 μm in C (applies to B), in E and in H (applies to G).
|
