FIGURE SUMMARY
Title

Notch receptor expression in neurogenic regions of the adult zebrafish brain

Authors
de Oliveira-Carlos, V., Ganz, J., Hans, S., Kaslin, J., and Brand, M.
Source
Full text @ PLoS One

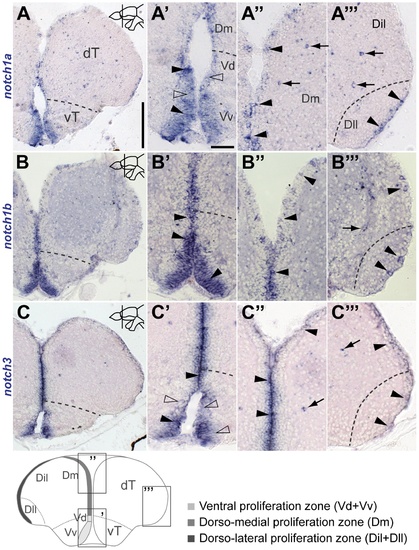
Notch receptor expression in the adult zebrafish telencephalon.
Notch receptors are differentially expressed in the ventricular zone of the adult zebrafish telencephalon. Brightfield micrographs of cross-sections at the indicated levels through the telencephalon; the schematic at the bottom-left illustrates the corresponding areas in the cross-section shown at a higher magnification. A, B and C, expression of zebrafish notch1a, notch1b and notch3 in the rostral telencephalon, respectively; dashed line indicates the division between ventral and dorsal telencephalon; A′ -C ′, Higher magnification of the ventral expression domain; A′′ -C ′′, Higher magnification of the dorsal expression domain; dashed line indicates the dorso-lateral most region. Arrowheads and unfilled arrowheads indicate, respectively, strongly and weakly expressing cells located at the ventricular surface; arrows indicate expressing cells in the parenchyme. Abbreviations: Dll, lateral part of the dorso-lateral telencephalic area; Dil, intermediate part of the dorso-lateral telencephalic area; Dm, dorso-medial telencephalic area; dT, dorsal telencephalic area; vT, ventral telencephalic area; Vd, dorsal nucleus of the ventral telencephalon; Vv, ventral nucleus of the ventral telencephalon. Scale bars = 200μm in A (applies to B, C); 25 μm in A′ (applies to B′ ,C′ , A′′ -C′′ and A′′′ -C ′′′).

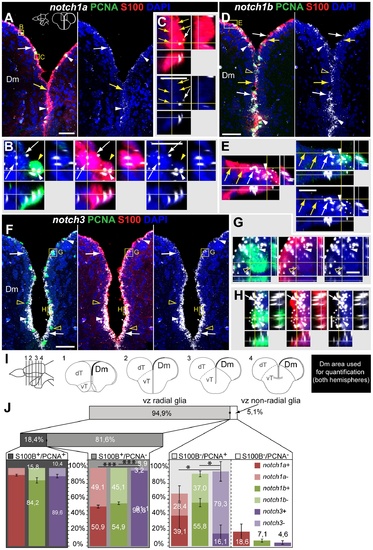
notch1a, notch1b and notch3 expression in radial glia and proliferating cells of the dorso-medial ventricular zone of the telencephalon. Confocal images showing localization of Notch receptors by FISH (white), radial glia labelled with S100β (red), and PCNA + proliferating cells (green); DAPI (blue) is used as nuclear counterstaining. Schematics in A indicate the cross-section levels through the telencephalon and the dorsal telencephalic area represented in the micrographs. A-C, notch1a and D-E, notch1b expressing cells are scattered throughout the dorso-medial ventricular zone of the dT and co-localize with both PCNA +/S100β + cells (filled arrowheads) and a subpopulation of PCNA -/S100β+ cells (white arrows); yellow arrows indicate Notch receptor -/PCNA -/S100β + cells; unfilled yellow arrowheads indicate notch1b - /PCNA + cells. F-H, notch3 expressing cells localize to a great extent with the S100β marker, including both PCNA (white arrows) and PCNA (white arrowheads) cells; unfilled yellow arrowheads indicate notch3 - /PCNA + cells. I, Schematics indicating the cross-sections levels through the telencephalon, along the rostro-caudal axis, and examples of Dm areas used for marker co-localization analysis in J. J, Quantification on the co-localization of Notch receptor by FISH with PCNA and S100β, for the Dm region; all ventricularly located cells of the indicated area were counted; cells were distinguished based on their glia character (S100β+ ), Notch receptor expression and proliferative status (PCNA +). n = 9 (fish), 4-6 tissue sections per fish, at the rostro-caudal levels indicated in I; total number of cells counted = 7245. Values represented as mean percentage SEM. Significance levels: p<0.00(***),p<0.05(*) . Abbreviations: Dm, dorso-medial telencephalic area; dT, dorsal telencephalic area; vT, ventral telencephalic area; Scale bars = 50 μmin A, in D and in F; 10 μm in C (applies to B), in E and in H (applies to G).

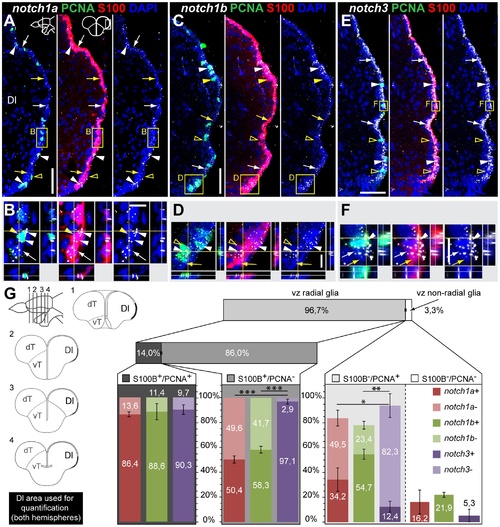
notch1a, notch1b and notch3 expression in radial glia and proliferating cells of the dorso-lateral telencephalic ventricular zone.
Confocal images showing localization of Notch receptors by FISH (white), radial glia labelled with S100β (red), and PCNA + proliferating cells (green); DAPI (blue) is used as nuclear counterstaining. Schematics in A indicate the cross-section levels through the telencephalon and the dorsal telencephalic area represented in the micrographs. A-B, notch1a and C-D, notch1b expressing cells are scattered throughout the dorso-lateral ventricular zone of the dT and localize with both PCNA +/S100β+ cells (arrowheads) and a subpopulation of PCNA -/S100β + cells (white arrows); yellow arrows indicate Notch receptor - /PCNA +/S100β- cells; unfilled yellow arrowheads indicate Notch receptor - /PCNA +/S100β- cells. E-F, notch3 expressing cells localize to a great extent with S100β, including both PCNA (white arrows) and PCNA (white arrowheads) cells; unfilled yellow arrowheads indicate notch3 -/PCNA + cells. G, Quantification on the co-localization of Notch receptor by FISH with PCNA and S100β, for the Dl region; schematics on the left indicate the cross-section levels through the telencephalon, along the rostro-caudal axis, and examples of Dl areas used for marker co-localization analysis; all ventricularly located cells of the indicated area were counted; cells were distinguished based on their glia character (S100β +), notch expression and proliferative status (PCNA +). n = 9 (fish), 4–6 tissue sections per fish, at different rostro-caudal levels; total number of cells counted = 6433. Values represented as mean percentage ± SEM. Significance levels: p<0.001(***),p<0.01(**) ,p<0.05(*) . Abbreviations: Dl, dorso-lateral telencephalic area; dT, dorsal telencephalic area; vT, ventral telencephalic area; Scale bars = 50 μm in C (applies to A) and in E; 10 μm in B, D and F.

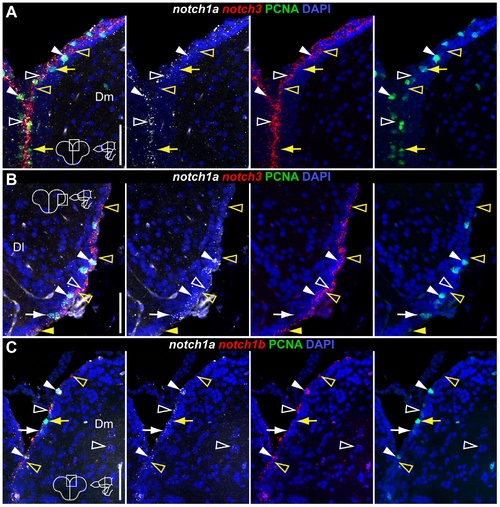
Overlapping and complementary Notch receptor expression in the dorsal telencephalon.
Confocal images showing localization of Notch receptors pairs by double FISH (white and red) and PCNA + proliferating cells (green); DAPI (blue) is used as nuclear counterstaining. Cross-sections at the indicated level through the telencephalon. Corresponding dorsal telencephalic areas represented in the micrographs are indicated in the cross section schematics of each panel. A, B, notch1a/3 co-expression in Dm and Dl, respectively. C, notch1a/b co-expression in Dm. These receptors are co-expressed both in PCNA + (filled white arrowheads) and PCNA - (unfilled white arrowheads) cells; within the PCNA + population, few cells are notch1a - /notch3 + (filled yellow arrowheads) while others are negative for both receptors (filled yellow arrows); within the PCNA - population, some cells express either notch3 or notch1b but not notch1a alone (unfilled yellow arrowheads). Scale bars = 50 μm.

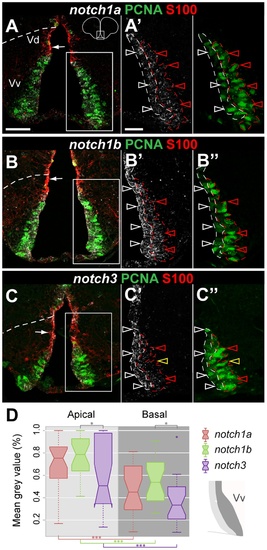
Notch receptor expression in the ventral telencephalic proliferation zone.
Confocal images showing the localization of Notch receptors by FISH (white) in PCNA+ proliferating cells (green) and in the S100β glial cells of Vd (red). A–A , notch1a, B–B, notch1b and C–C , notch3 expression in the ventral telencephalon. All three receptors are express in S100β cells of Vd (white arrows). A ′ -A ′′, B ′ -B ′′ and C ′ -C ′′show the individual channels for Notch receptor expression and PCNA at a higher magnification of the respective boxed areas. Notch receptor + /PCNA + cells with apical nucleus (unfilled white arrowheads) display a stronger expression intensity than PCNA cells with basal nucleus (unfilled red arrowheads); unfilled yellow arrowhead indicate Notch receptor - /PCNA + cells. Scale bars = 50 μm in A′ (applies to B and C) and 25 in A ′ (applies to B ′, C ′ and A ′′ -C ′′). D, The notched boxplot represents the relative mean grey values of notch expression in proliferating cells with apical or basal nucleus, as illustrated in the schematics and by the respective dashed lines indicated in the higher magnification pictures shown above; the middle line of the box represents the median; the bottom and top of the box represents the 25 and 75 percentiles, respectively; whiskers indicate the minimum and maximum; circle indicates an outlier; total n = 13. Significance levels: p<0.001(***),p<0.05(*) .

EXPRESSION / LABELING:
Genes:
Fish:
Anatomical Term:
Stage: Adult

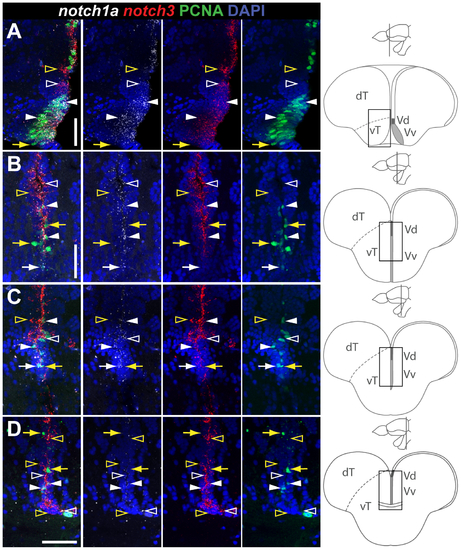
Overlapping and complementary notch1a/3 expression in the ventral telencephalic proliferation zone, along the rostro-caudal axis.
Confocal images showing localization of notch1a (white) and notch3 (red) by double FISH (white and red) and PCNA proliferating cells (green); DAPI (blue) is used as nuclear counterstaining. Areas represented in the micrographs are indicated in the cross-section schematics on the right as well as the different levels through the telencephalon. A-D, notch1a and notch3 expression domains along the rostro-caudal vT proliferation zone. Co-expression of these receptors both in PCNA (white filled arrowheads) and PCNA cells (unfilled white arrowheads); a few PCNA cells are Notch receptor (yellow arrows) while others are notch1a + /notch3 - (white filled arrows); unfilled yellow arrowheads indicate notch1a - /notch3+/PCNA - cells. Abbreviations: dT, dorsal telencephalic area; vT, ventral telencephalic area; Vd, dorsal nucleus of the ventral telencephalon; Vv, ventral nucleus of the ventral telencephalon. Scale bars = 50μm in A, B (applies to C) and D.

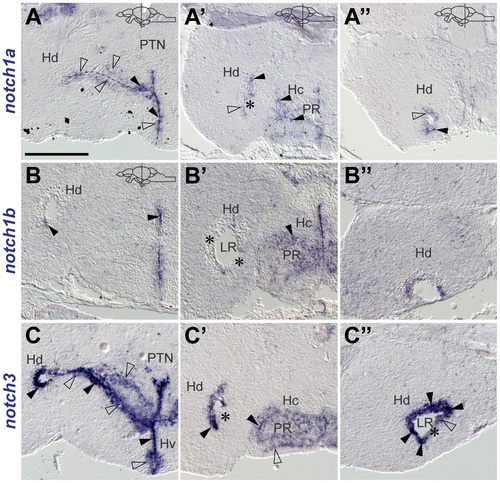
Notch receptor expression in the adult zebrafish hypothalamus.
Notch receptors are differentially expressed throughout the hypothalamus. Cross-sections at the indicated level through the diencephalon. Brightfield images show the expression of A-A′′ , notch1a, B-B. ′′, notch1b and C-C , notch3 at different rostro-caudal levels of the hypothalamus. Strong (filled arrowheads) and weak (unfilled arrowheads) expressing cells are detected. Asterisks () indicate areas of no or very weak expression in the Hd. Abbreviations: DiV, diencephalic ventricle; Hc, periventricular caudal hypothalamus; Hd, periventricular dorsal hypothalamus; Hv, periventricular ventral hypothalamus; LR, lateral recess of the DiV; PR, posterior recess of the DiV; PTN, posterior tuberal nucleus. Scale bar = 100 μm in A (applies to all).

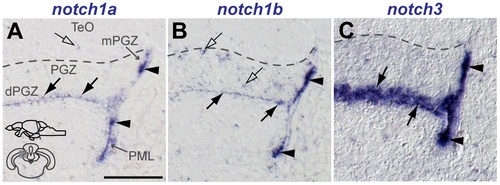
Notch receptor expression in the adult zebrafish optic tectum.
Cross-sections at the indicated level through the mesencephalon; optic tectum area shown in the micrographs is indicated in the cross section schematic in A. Brighfield images show the expression (by ISH) of A, notch1a, B, notch1b and C, notch3 along the PML and mPGZ (filled arrowheads) and in the dPGZ (filled arrows). A few notch1a and notch1b cells are also found in more superficial layers of the PGZ and TeO (unfilled arrows). Abbreviations: PGZ, periventricular gray zone of the optic tectum; dPGZ, deep layer of the PGZ; mPGZ, mitotic region of the PGZ; PML, posterior mesencephalic lamina; TeO, optic tectum. Scale bars = 100 μm in A (applies to all).

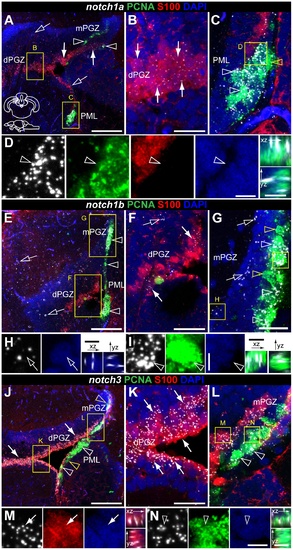
Notch receptor expression in radial glia and proliferating cells of the adult zebrafish optic tectum.
Cross-sections at the indicated level through the mesencephalon; optic tectum area shown in the micrographs is indicated in the cross section schematic in A. Confocal images showing localization of the glial marker S100β (red) and the proliferation marker PCNA (green), with A-D, notch1a, E-I, notch1b and J-N,notch3 by FISH (white). A, notch1a, E, notch1b and J, notch3 are present in PCNA + cells of the mPGZ and PML (unfilled white arrowheads) and in S100β glial cells of the dPGZ; cells in the superficial layer of the PGZ expressing notch1a and notch1b are also found (unfilled arrows), with relative more abundance for the notch1b receptor in this layer; B, C, F,G and K,L are higher magnifications of the respective framed areas in A, E and J, showing the overlap of notch expression with S100 (filled arrows) or PCNA (unfilled white arrowheads); unfilled yellow arrowheads in C, G and J indicate a few Notch receptor - /PCNA + cells; D, H, I, M,N, close ups of Notch receptor expressing cells in the above mentioned areas and orthogonal views of the indicated cells. Abbreviations: PGZ, periventricular gray zone of the optic tectum; dPGZ, deep layer of the PGZ; mPGZ, mitotic region of the PGZ; PML, posterior mesencephalic lamina. Scale bars = 100μm in A, E and J; 20 μm in B (applies to C), in F, G and K (applies to L); 5 μm in D, I (applies to H) and N (applies to M).

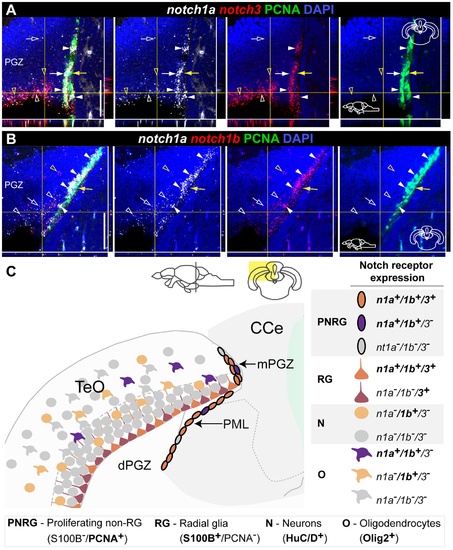
Overlapping and complementary notch1a/3 expression in the adult zebrafish optic tectum.
Confocal images showing localization of Notch receptor pairs by double FISH (white and red) and PCNA + proliferating cells (green). Cross-sections at the indicated level through the mesencephalon; tectal area shown in the micrographs is indicated in the cross section schematics. A, notch1a/3 and B, notch1a/1b expression domains in the dPGZ and mPGZ layers. Co-expression of these receptors both in PCNA + (filled white arrowheads) and PCNA cells (unfilled white arrowheads); notch3 -only cells in A and notch1b -only cells in B are indicated by unfilled yellow arrowheads; white arrows indicate notch1a + /notch3 - /PCNA + cells in A; a few PCNA cells are Notch receptor (filled yellow arrows); unfilled white arrows indicate cells positive for notch1a alone. C, Summary of Notch receptor expression pattern and cellular characteristics in the TeO. Abbreviations: Cce, corpus cerebelli; PGZ, periventricular gray zone of the optic tectum; dPGZ, deep layer of the PGZ; mPGZ, mitotic region of the PGZ; PML, posterior mesencephalic lamina; TeO, optic tectum. Scale bars = 50 μm.

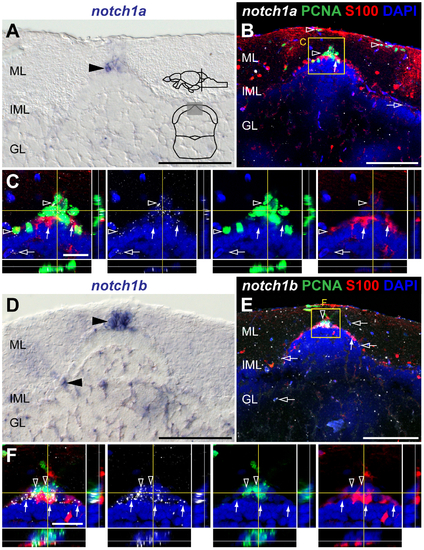
notch1a and notch1b expression in the adult cerebellar niche.
Cross-sections at the indicated level through the mesencephalon; cerebellar area shown in the micrographs is indicated in the cross-section schematic in A. Brightfield images show expression of A, notch1a and D, notch1b in the cerebellum (arrowheads). Confocal images showing localization of the glial marker S100β (red) and PCNA (green), with B-C, notch1a and E-F, notch1b by FISH (white). B-C, Expression of notch1a localizes with a large fraction of PCNA+ cells in the niche (unfilled arrowheads); weak (white arrow) or no expression of notch1a is detected in the Bergmann glia (S100β+ ). E-F, notch1b is expressed in a subpopulation of PCNA cells (unfilled arrowheads) and in a few S100β+ cells (white arrows). A few scattered notch1a+ and notch1b + cells in the ML, IML and GL do not localize with the analysed markers (unfilled arrows). Abbreviations: GL, granule cell layer; IML, intermediate layer; ML, molecular layer. Scale bars = 50 μm in A, B, D and E; 20 μm in C and F.

EXPRESSION / LABELING:
Genes:
Fish:
Anatomical Term:
Stage: Adult

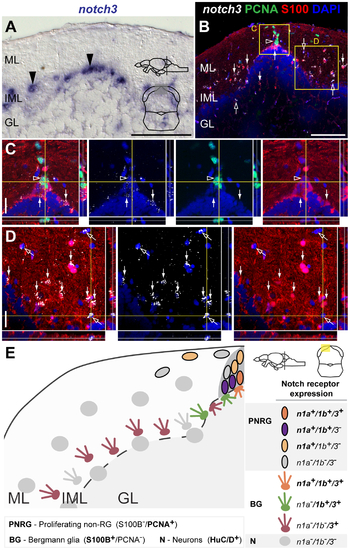
notch3 expression in the adult cerebellar niche.
Cross-sections at the indicated level through the mesencephalon; cerebellar area shown in the micrographs is indicated in the cross-section schematic. A, Brightfield image shows notch3 expressing cells in the cerebellum (black arrowheads). B-D, Confocal images showing localization of the glial marker S100β (red) and PCNA (green), with notch3 by FISH (white). B-C, notch3 is weakly expressed in a small subset of PCNA+ cells in the stem cell niche (unfilled arrowhead). B–D, Strong notch3 expression is detected in S100β+ cells indicated by the white arrows; notch3 expression is also detected in some scattered cells of the ML, IML and GL that do not localize with the analysed markers (unfilled arrows); E, Summary of the expression pattern and cellular characteristics of Notch receptor expressing cells in the adult cerebellum. Abbreviations: GL, granule cell layer; IML, intermediate layer; ML, molecular layer. Scale bars = 50 μm in A and B; 20 μm in C and D.

EXPRESSION / LABELING:
Gene:
Fish:
Anatomical Term:
Stage: Adult

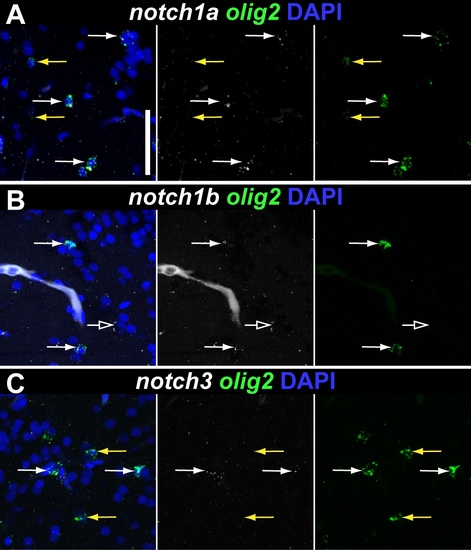
Notch receptor expression in telencephalic oligodendrocytes. Confocal images of double FISH showing the localization of Notch receptor (white) and olig2 (green) in the dorsal telencephalon parenchyme. A-C, notch1a, notch1b and notch3 are expressed in a subpopulation of parenchymal olig2 cells (white arrows). Yellow arrows indicate Notch receptor - /olig2 + cells; unfilled white arrows in B indicate notch1b + /olig2 - cells. Scale bar = 50 μ in A (applies to all).

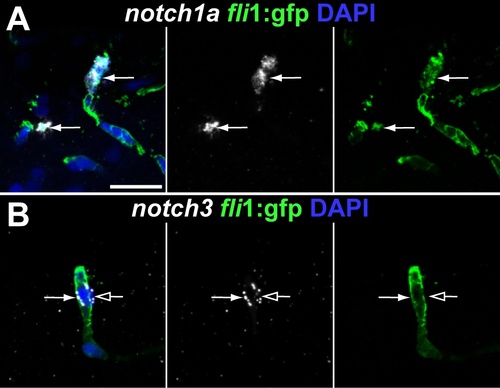
Notch receptor expression in fli1:gfp endothelial cells in the telencephalic parenchyme. Confocal images showing localization of notch1a and notch3 and gfp + endothelial cells in the dorsal telencephalon parenchyme. A–B notch1a and notch3 expression in a few endothelial cells (white arrows); unfilled arrow in B indicates a notch3 + /gfp - cell adjacent to the blood vessel. Scale bar = 20 in A (applies to B).

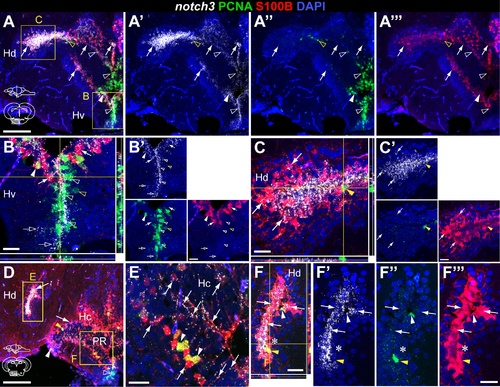
notch3 expression in glia and proliferating cells of the adult zebrafish hypothalamus. Confocal images showing localization of notch3 mRNA by FISH (white), radial glia labelled with S100β (red), and PCNA + proliferating cells (green). Cross-sections at the indicated levels through the diencephalon; hypothalamic area shown in the micrographs is indicated in the cross-section schematics. A, B, notch3 is expressed in most PCNA+ /100β- cells (filled white arrowheads) and in PCNA +/S100β - cells (unfilled white arrowheads) of the Hv; unfilled yellow arrowheads indicate notch3 - /PCNA +/S100β cells. A–F, notch3 localizes with most S100β cells of Hd and Hc, PCNA + (filled white arrowheads) or PCNA (filled white arrows); filled yellow arrowhead indicates a notch3 -/PCNA +/S100β + cell. Notice the notch3 expression in the S100β + cellular processes in Hc (in E). Asterisk indicates a S100β group of cells in Hd that is negative for notch3. Abbreviations: Hc, caudal zone of the periventricular hypothalamus; Hd, dorsal zone of the periventricular hypothalamus; Hv, ventral zone of the periventricular hypothalamus: PR, posterior recess of the diencephalic ventricle. Scale bar = 100 μm in A and D, 20 μm in B, B , C, C , E, F, F .

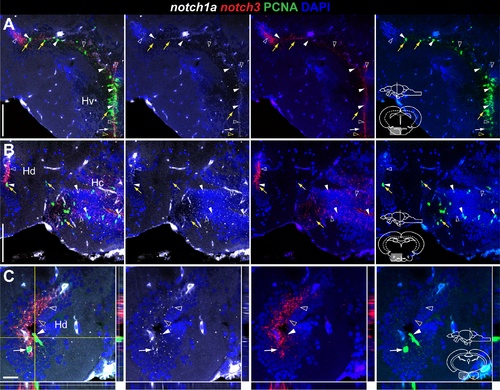
Overlapping and complementary notch1a/3 expression in the adult zebrafish hypothalamus. Confocal images of double FISH showing the localization of notch1a (white), notch3 (red), and PCNA (green). Cross-sections at the indicated level through the diencephalon; hypothalamic area shown in the micrographs is indicated in the cross-section schematics. A–C, notch1a is expressed in a subpopulation of notch3 + /PCNA + cells in Hv, Hd and Hc (filled white arrowheads); yellow arrows indicate Notch receptor - /PCNA + cells; unfilled yellow arrowheads indicate cells expressing notch3 alone. notch1a expression partially overlaps with the notch3 + /PCNA - population (unfilled white arrowheads); there are a few notch1a + /notch3 - /PCNA cells in Hv and Hd (filled white arrows). Abbreviations: Hc, caudal zone of the periventricular hypothalamus; Hd, dorsal zone of the periventricular hypothalamus; Hv, ventral zone of the periventricular hypothalamus. Scale bar = 100 μ in A (applies to B).

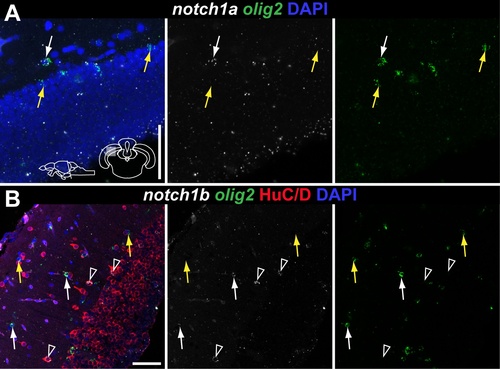
notch1a and notch1b expression in olig2+ and HuC/D + cells of the optic tectum. Confocal images of double FISH showing the localization of notch1a/1b (white), olig2 (green) and HuC/D (red) in the superficial layer of the optic tectum. Cross-sections at the indicated level through the mesencephalon; tectal area shown in the micrographs is indicated in the cross section schematic in A. A–B, notch1a and notch1b are expressed in a subpopulation of olig2 cells (white arrows); yellow arrows indicate Notch receptor - /olig2 + cells. B, notch1b is also expressed in olig2 - /Hu + cells (unfilled white arrowheads). Scale bars = 50 μm.

Unillustrated author statements

EXPRESSION / LABELING:
Gene:
Fish:
Stage: Adult
Acknowledgments
This image is the copyrighted work of the attributed author or publisher, and ZFIN has permission only to display this image to its users. Additional permissions should be obtained from the applicable author or publisher of the image. Full text @ PLoS One