Fig. 7
|
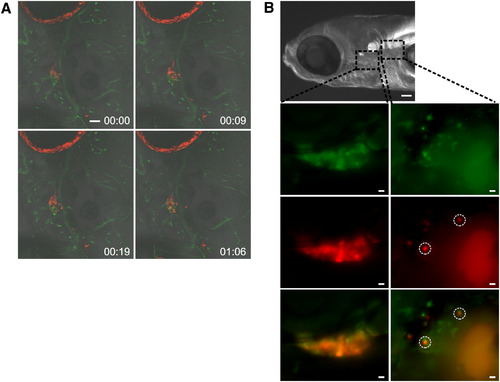
Intrathymic Motility and Egress of T Cells (A) Still images taken from a time-lapse recording of ikaros:tdEosFP thymocytes of a 5 dpf embryo, immediately after photoconversion (00:00) and at 9 (00:09), 19 (00:19), and 66 (01:06) min thereafter. Representative results for four embryos. The highest average velocity over a 60 min observation period was 3.8 μm/min. Scale bars represent 50 μm. (B) Colonization of the kidney of ikaros:tdEosFP fish at 6 dpf after photoconversion of thymocytes at 5 dpf. The top panel (scale bar represents 100 μm) depicts a bright-image indicating the regions of the thymus (left panels underneath) and the kidney (right panels underneath). The fluorescent images depict, from top to bottom, the green, red, and combined channels; two double-positive cells in the kidney are marked by white circles. Representative results for 15 embryos. Scale bars represent 10 μm. |
| Gene: | |
|---|---|
| Fish: | |
| Anatomical Terms: | |
| Stage Range: | Day 5 to Day 6 |
Reprinted from Immunity, 36(2), Hess, I., and Boehm, T., Intravital Imaging of Thymopoiesis Reveals Dynamic Lympho-Epithelial Interactions, 298-309, Copyright (2012) with permission from Elsevier. Full text @ Immunity

