
FIGURE
Fig. S3
Fig. S3
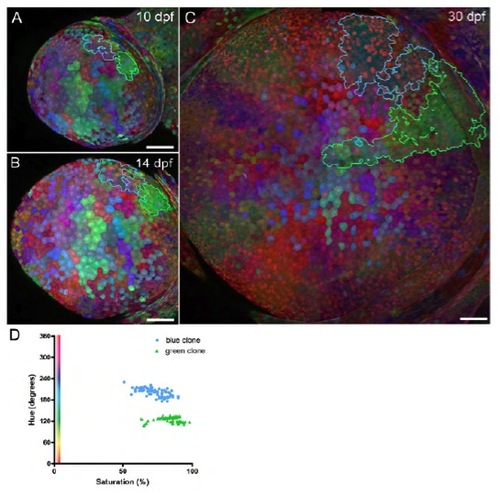
Time-lapse imaging of clonal growth in the cornea. (A-C) Cornea clones imaged at 10 (A), 14 (B) and 30 (C) dpf. All images are montages of maximal intensity projections, shown at the same scale. One blue clone (blue outline) and one green clone (green outline) were traced. Both clones showed substantial centripetal growth. (D) Hue and saturation values of cells in the blue or green clone at 30 dpf are plotted. Measurements were made from 5�5 pixel areas from individual optical sections. Cells within a cohesive clone are consistent in their color profiles. |
Expression Data
Expression Detail
Antibody Labeling
Phenotype Data
Phenotype Detail
Acknowledgments
This image is the copyrighted work of the attributed author or publisher, and
ZFIN has permission only to display this image to its users.
Additional permissions should be obtained from the applicable author or publisher of the image.
Full text @ Development