Fig. 6
|
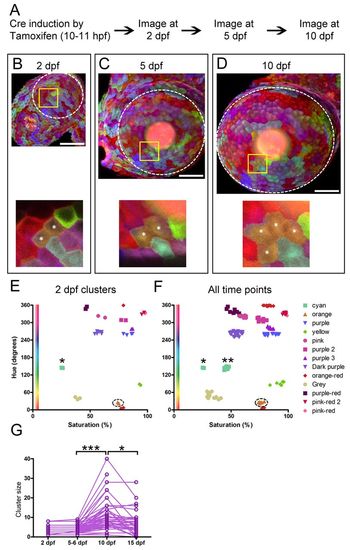
Inheritance and stability of color. (A) Experimental procedure for time-lapse imaging. (B-D) A Ubi:Zebrabow-M;ubi:CreER transgenic animal imaged from 2 to 10 dpf. Images are shown at the same scale at each developmental stage. Yellow boxed regions are shown at higher magnification in the bottom panels. (E,F) Color profiles for individual cells are plotted. At 2 dpf, single-color cell clusters are plotted on the Hue-Saturation graph (E). The orange cluster shown in B-D (asterisks) is circled. We re-identified individual clusters at 5 and 10 dpf, and plotted all of the cells from all clusters from all time points (2, 5 and 10 dpf) (F). The orange cluster showed highly similar color profiles at all time points, as do most other clusters. One exception is a cyan cluster (asterisk), which showed an increase in saturation from 2 dpf to 5 dpf. (G) Analysis of cluster size (number of cells within a cluster) at different time points. Cluster size increases between 5-6 dpf and 10 dpf (***P<0.001) and decreases thereafter (*P<0.05). Significance calculated by one-way analysis of variance with Bonferroni post hoc test. Sample size: 2 dpf, n=33; 5-6 dpf, n=86; 10 dpf, n=86; 15 dpf, n=48. Scale bars: 50 μm. |

