
FIGURE
Fig. S2
Fig. S2
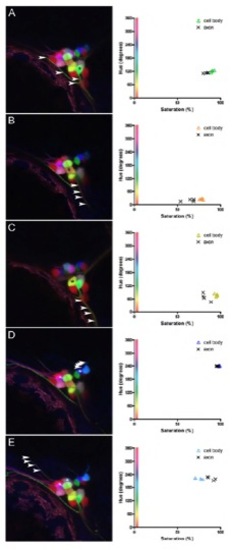
Trigeminal sensory ganglion shown in Fig. 3D was tested for color constancy. (A-E) For five differently colored cells, hue and saturation values of their cell bodies (asterisk) in different z-planes and at different points along axons (arrowheads) were measured and plotted. Values are averaged from a 5×5 pixel square of a single optical section. |
Expression Data
Expression Detail
Antibody Labeling
Phenotype Data
Phenotype Detail
Acknowledgments
This image is the copyrighted work of the attributed author or publisher, and
ZFIN has permission only to display this image to its users.
Additional permissions should be obtained from the applicable author or publisher of the image.
Full text @ Development