Fig. 2
|
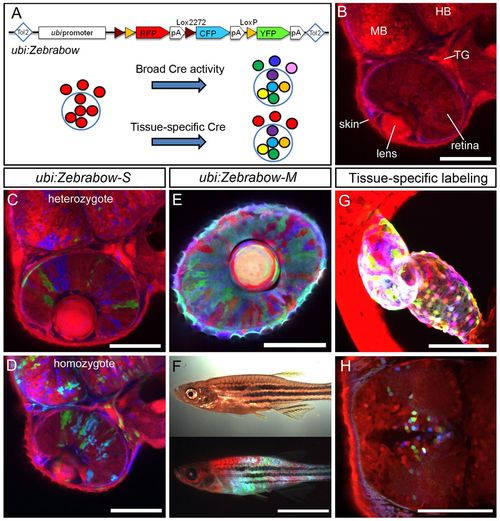
Ubiquitous and persistent Zebrabow expression with ubi:Zebrabow transgenic fish. (A) Top, diagram of the ubi:Zebrabow construct; bottom, schematic of ubi:Zebrabow expression. Small black circles indicate cells in the entire animal, and the large blue circle indicates an organ of interest. Recombination can be induced either broadly or in a tissue-specific manner. (B-D) Confocal images of ubi:Zebrabow-S transgenic at 2 dpf. In the default state, RFP is expressed (B). With Cre protein injection, three colors are observed in heterozygotes (red, green, blue) (C) and increased color diversity is detected in homozygotes (D). (E,F) Combinatorial Zebrabow expression in ubi:Zebrabow-M transgenic injected with Cre. (E) Confocal section of the eye of a 2 dpf embryo. (F) Juvenile fish (30 dpf) viewed under bright-field illumination (top) or fluorescent illumination (bottom). (G) Heart-specific recombination in cmlc2:CreER;ubi:Zebrabow-M larvae. (H) Diencephalon-specific recombination in pax2a:CreER19;ubi:Zebrabow-M larvae. MB, midbrain; HB, hindbrain; TG, trigeminal ganglion. Scale bars: 100 μm in B-E,G,H; 5 mm in F. |

