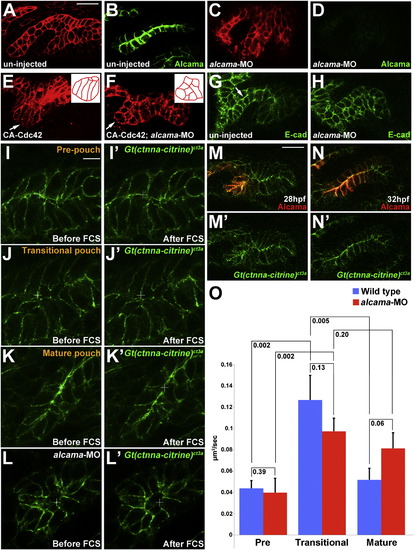
Alcama Is Required for Pouch Bilayer Formation and AJ Stabilization(A?D) her5:mCherryCAAX fluorescence (red) and Alcama immunohistochemistry (green) show loss of Alcama protein and an aberrant multilayered pouch morphology in alcama-MO embryos (C and D) compared to un-injected controls (A and B). Scale bar, 20 μM.(E and F) her5:mCherryCAAX labeling shows that the elongated morphology of pouch cells (arrows) resulting from CA-Cdc42 misexpression (n = 49/72) is suppressed by Alcama depletion (n = 0/67). Insets show schematics of pouch cell morphology.(G and H) Immunohistochemistry shows that E-cadherin still localizes to cell-cell junctions in the absence of Alcama protein yet the apical enrichment seen in wild-type mature pouches (arrow) is missing.(I?L) Imaging of α-catenin localization during three phases of wild-type pouch formation (I?K) and during a comparable phase of alcama-MO development (L) when wild-type pouches would have matured into bilayers. Crosshairs show target regions before FCS laser illumination (I?L) and 25 s after (I′?L′). Scale bar, 5 μM.(M and N) Alcama immunohistochemistry in wild-type Gt(ctnna-citrine)ct3a embryos shows that the appearance of Alcama (red) at apical and lateral cell-cell junctions corresponds to a transition from disorganized to strongly apical localization of α-catenin (green). Scale bar, 20 μM.(O) FCS measurements of endogenous α-catenin mobility in wild-type embryos show a significant increase in mobility from prepouch to transitional endoderm and a subsequent decrease in mature bilayers. In alcama-MO embryos, α-catenin mobility increases from prepouch to transitional endoderm but fails to decrease at a stage comparable to the mature wild-type pouch. n = 16 for each. Data represent mean � SEM, and p values are shown for each comparison.See also Figure S4 and Movie S7.
|
