
FIGURE
Fig. 1
Fig. 1
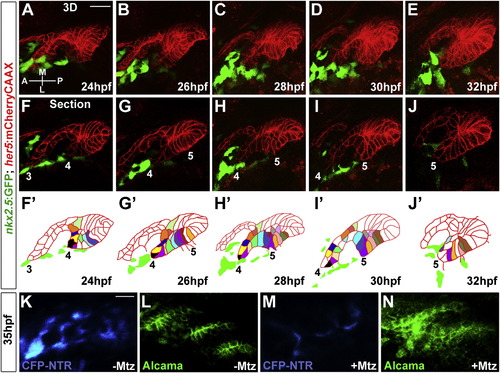
(F?J) Representative sections from the same time-lapse recording (see Movie S2) show various stages of development of pouches 3-5. In the schematics (F′?J′), the tracking of individually color-coded pouch cells highlights cell rearrangements. Cells that we could not track through the entire recording were left uncolored. |
Expression Data
| Genes: | |
|---|---|
| Antibody: | |
| Fish: | |
| Condition: | |
| Anatomical Terms: | |
| Stage Range: | Prim-5 to Prim-15 |
Expression Detail
Antibody Labeling
Phenotype Data
| Fish: | |
|---|---|
| Condition: | |
| Observed In: | |
| Stage: | Prim-15 |
Phenotype Detail
Acknowledgments
This image is the copyrighted work of the attributed author or publisher, and
ZFIN has permission only to display this image to its users.
Additional permissions should be obtained from the applicable author or publisher of the image.
Reprinted from Developmental Cell, 24(3), Choe, C.P., Collazo, A., Trinh, L.A., Pan, L., Moens, C.B., and Crump, J.G., Wnt-Dependent Epithelial Transitions Drive Pharyngeal Pouch Formation, 296-309, Copyright (2013) with permission from Elsevier. Full text @ Dev. Cell