
Fig. 51
- ID
- ZDB-FIG-091217-42
- Publication
- Parichy et al., 2009 - Normal table of postembryonic zebrafish development: Staging by externally visible anatomy of the living fish
- Other Figures
-
- Fig. 1
- Fig. 2
- Fig. 5
- Fig. 6
- Fig. 8
- Fig. 10
- Fig. 11
- Fig. 13
- Fig. 14
- Fig. 16
- Fig. 17
- Fig. 18
- Fig. 19
- Fig. 21
- Fig. 22
- Fig. 23
- Fig. 24
- Fig. 25
- Fig. 26
- Fig. 27
- Fig. 28
- Fig. 32
- Fig. 33
- Fig. 34
- Fig. 35
- Fig. 36
- Fig. 37
- Fig. 38
- Fig. 39
- Fig. 40
- Fig. 41
- Fig. 42
- Fig. 43
- Fig. 44
- Fig. 45
- Fig. 46
- Fig. 47
- Fig. 48
- Fig. 49
- Fig. 50
- Fig. 51
- Fig. 52
- Fig. 53
- Fig. 54
- Fig. 55
- Fig. 56
- Fig. 57
- All Figure Page
- Back to All Figure Page
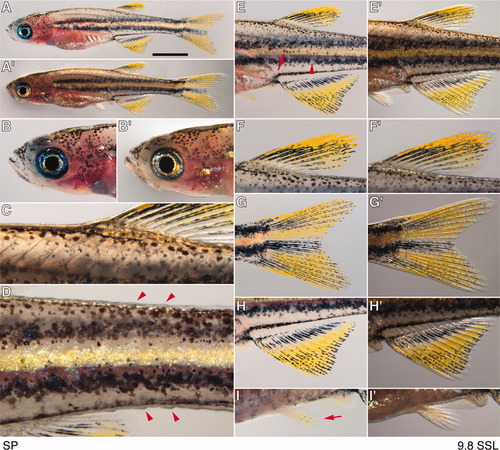
Onset of posterior squamation; SP, 9.8 mm SL (standard length). A,A′: Whole body. Scale bar = 2 mm. B,B′: Detail of head. C: Dorsal flank showing absence of scales anterior to dorsal fin. D: Posterior tail, showing raised ridges of scales dorsally and ventrally (arrowheads). E,E′: Middle trunk showing dorsal and anal fins and pigment pattern. Stripes are increasingly distinct except for a few remaining gaps (arrowhead) and fewer embryonic/early larval melanophores are found in the interstripe region (arrow). F,F′: Dorsal fin. G,G′: Caudal fin, with increasingly distinct stripes. H,H′: Anal fin, with the first distinct melanophore stripe. I,I′: The pelvic fin (arrow) now has several distinct rays as well as a few melanophores amongst them. |