
FIGURE
Fig. 24
- ID
- ZDB-FIG-091217-18
- Publication
- Parichy et al., 2009 - Normal table of postembryonic zebrafish development: Staging by externally visible anatomy of the living fish
- Other Figures
-
- Fig. 1
- Fig. 2
- Fig. 5
- Fig. 6
- Fig. 8
- Fig. 10
- Fig. 11
- Fig. 13
- Fig. 14
- Fig. 16
- Fig. 17
- Fig. 18
- Fig. 19
- Fig. 21
- Fig. 22
- Fig. 23
- Fig. 24
- Fig. 25
- Fig. 26
- Fig. 27
- Fig. 28
- Fig. 32
- Fig. 33
- Fig. 34
- Fig. 35
- Fig. 36
- Fig. 37
- Fig. 38
- Fig. 39
- Fig. 40
- Fig. 41
- Fig. 42
- Fig. 43
- Fig. 44
- Fig. 45
- Fig. 46
- Fig. 47
- Fig. 48
- Fig. 49
- Fig. 50
- Fig. 51
- Fig. 52
- Fig. 53
- Fig. 54
- Fig. 55
- Fig. 56
- Fig. 57
- All Figure Page
- Back to All Figure Page
Fig. 24
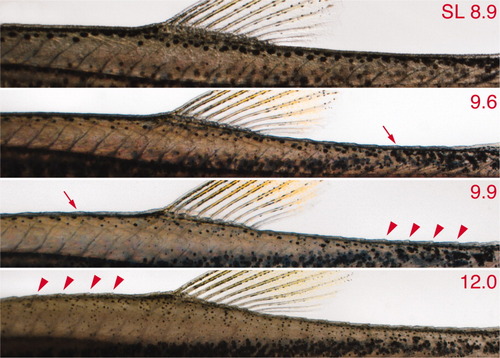
Scale development revealed by transmitted illumination. A single individual is shown (standard length [SL] at upper right). 8.9, An initially smooth dorsum. 9.6, onset of posterior squamation is indicated by the appearance of raised ridges (arrow); 9.9, scales are well-formed posteriorly (arrowheads) and are starting to develop anteriorly (arrow); 12.0, scales are completed anteriorly (arrowheads). |
Expression Data
Expression Detail
Antibody Labeling
Phenotype Data
Phenotype Detail
Acknowledgments
This image is the copyrighted work of the attributed author or publisher, and
ZFIN has permission only to display this image to its users.
Additional permissions should be obtained from the applicable author or publisher of the image.
Full text @ Dev. Dyn.