
FIGURE
Fig. 5
- ID
- ZDB-FIG-091217-4
- Publication
- Parichy et al., 2009 - Normal table of postembryonic zebrafish development: Staging by externally visible anatomy of the living fish
- Other Figures
-
- Fig. 1
- Fig. 2
- Fig. 5
- Fig. 6
- Fig. 8
- Fig. 10
- Fig. 11
- Fig. 13
- Fig. 14
- Fig. 16
- Fig. 17
- Fig. 18
- Fig. 19
- Fig. 21
- Fig. 22
- Fig. 23
- Fig. 24
- Fig. 25
- Fig. 26
- Fig. 27
- Fig. 28
- Fig. 32
- Fig. 33
- Fig. 34
- Fig. 35
- Fig. 36
- Fig. 37
- Fig. 38
- Fig. 39
- Fig. 40
- Fig. 41
- Fig. 42
- Fig. 43
- Fig. 44
- Fig. 45
- Fig. 46
- Fig. 47
- Fig. 48
- Fig. 49
- Fig. 50
- Fig. 51
- Fig. 52
- Fig. 53
- Fig. 54
- Fig. 55
- Fig. 56
- Fig. 57
- All Figure Page
- Back to All Figure Page
Fig. 5
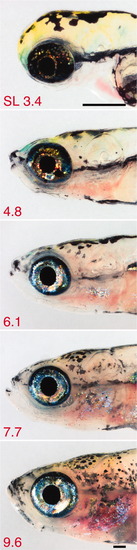
Head development. Marked shape change occurs during the embryo-larval transition, with additional more subtle changes during later development. Standard length (SL) of individuals shown is in red at the lower left of each panel. Images shown are at decreasing magnifications. Scale bars = 3.4 and 9.6, 250 μm. |
Expression Data
Expression Detail
Antibody Labeling
Phenotype Data
Phenotype Detail
Acknowledgments
This image is the copyrighted work of the attributed author or publisher, and
ZFIN has permission only to display this image to its users.
Additional permissions should be obtained from the applicable author or publisher of the image.
Full text @ Dev. Dyn.