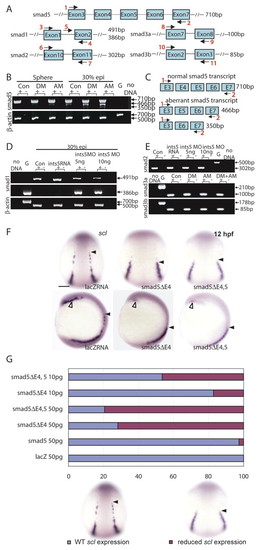
Knockdown of Ints5 perturbs splicing of smad1 and smad5 RNA. (A) Schematic representation of the smad5, smad1, smad2, smad3a and smad3b genomic loci. Numbered black arrows indicate the position of primers used in RT-PCRs to detect splicing. The sizes of the predicted products using various primer pairs are indicated on the right. (B) At both sphere and 30% epiboly stages, aberrantly spliced smad5 transcripts accumulate in ints5 donor morpholino (DM)- and acceptor mopholino (AM)-injected embryos. β-actin control transcripts are correctly spliced to yield a 500 bp product from cDNA in comparison to a 700 bp genomic DNA product, G. (C) Schematic representation to show the wild-type 710 bp smad5 transcript, and aberrant smad5 transcripts that lack exon 4 (466 bp product), or lack both exon 4 and exon 5 (350 bp product). (D) Unspliced smad1 (386 bp product with primer pair 4 and 5) and correctly spliced smad1 (491 bp with primer pair 3 and 4) transcripts in 30% epiboly ints5 morpholino-injected embryos. (E) Amplification of smad2, smad3a and smad3b with the primer pairs indicated in A shows correctly spliced products in ints5 morphants. Amplification with primers spanning other regions of these genes also did not show aberrant splicing (data not shown). (F,G) Overexpression of truncated smad5 transcripts causes hematopoiesis defects, similar to ints5 morphants. (F) Whole-mount in situ hybridization to detect scl in control embryos (left), and in embryos injected with smad5ΔE4 RNA (middle) or smad5ΔE4,5 RNA (right) at 12 hpf. Black arrowheads indicate the anterior limit of scl expression in the ICM; open arrowheads mark scl expression in the RBI. Upper panel shows dorsal views with anterior to the top; lower panel shows lateral views with dorsal to the right. (G) Histogram showing the percentage of injected embryos with wild-type (blue) or reduced (magenta) scl expression levels. Scale bar: 50 μm.
|

