
FIGURE
Fig. S2
- ID
- ZDB-FIG-090617-44
- Publication
- Bae et al., 2009 - Anatomy of zebrafish cerebellum and screen for mutations affecting its development
- Other Figures
- All Figure Page
- Back to All Figure Page
Fig. S2
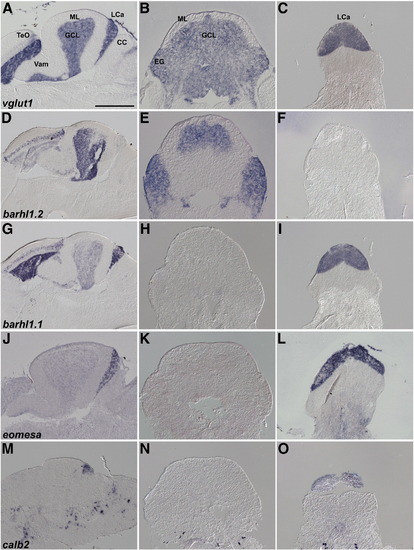
Expression of granule cell markers in Va, CCe, EG, and LCa. In situ hybridization of sagittal (A, D, G, J, M), and cross sections at the position of CCe/EG (B, E, H, K, N) and LCa (C, F, I, L, O). D, G, J, and M are identical to F, G, H, and I in Fig. 3. Note that expression of barhl1.1 and eomesa in the GCL is very low and not detected in the cross sections (H and K) but it is detected in the GCL of Va and CCe in the sagittal sections (G, J). Scale bar: 500 μm. |
Expression Data
Expression Detail
Antibody Labeling
Phenotype Data
Phenotype Detail
Acknowledgments
This image is the copyrighted work of the attributed author or publisher, and
ZFIN has permission only to display this image to its users.
Additional permissions should be obtained from the applicable author or publisher of the image.
Reprinted from Developmental Biology, 330(2), Bae, Y.K., Kani, S., Shimizu, T., Tanabe, K., Nojima, H., Kimura, Y., Higashijima, S.I., and Hibi, M., Anatomy of zebrafish cerebellum and screen for mutations affecting its development, 406-426, Copyright (2009) with permission from Elsevier. Full text @ Dev. Biol.