
- Title
-
gnas Knockdown Induces Obesity and AHO Features in Early Zebrafish Larvae
- Authors
- Abbas, A., Hammad, A.S., Zakaria, Z.Z., Al-Asmakh, M., Hussain, K., Al-Shafai, M.
- Source
- Full text @ Int. J. Mol. Sci.
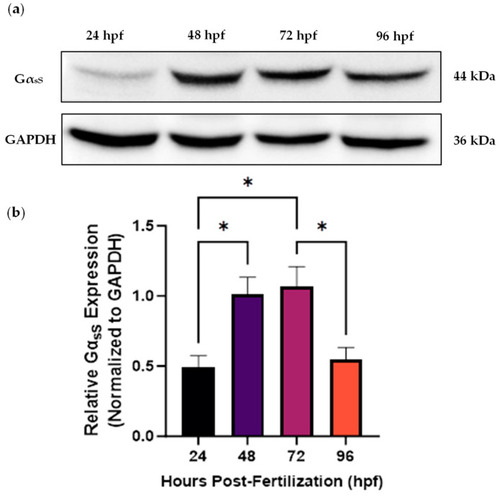
Western blot analysis of the temporal expression pattern of the short Gαs isoform (GαsS) in whole wild-type zebrafish from 24 to 96 h post-fertilization (hpf). ( |
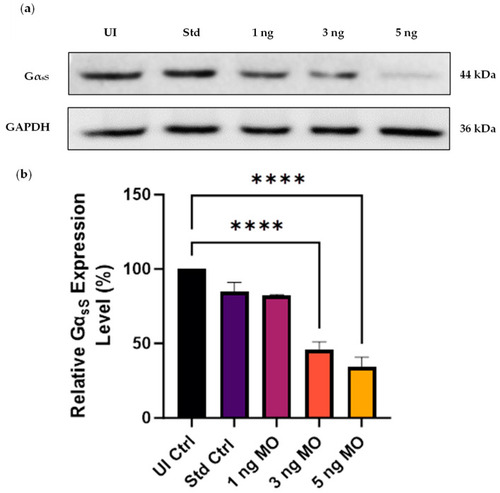
Western blot analysis of the knockdown efficiency of the three |
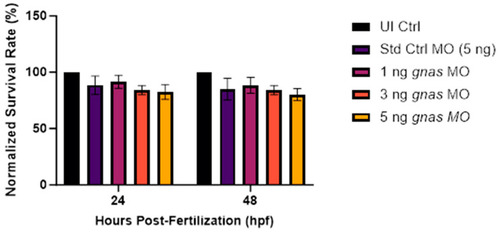
The survival rates at 24 and 48 hpf of the zebrafish embryos ( |
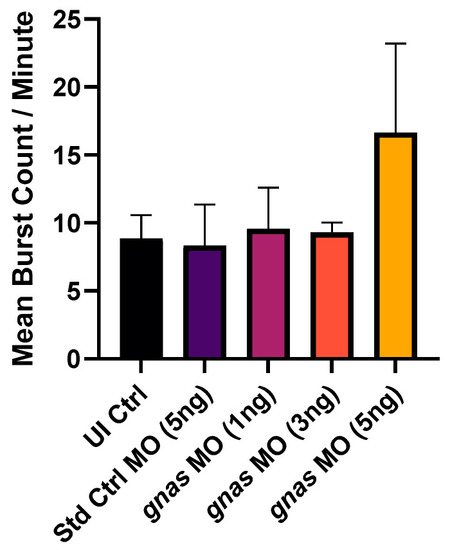
The rate of tail flicks at 24 hpf of the zebrafish embryos ( PHENOTYPE:
|
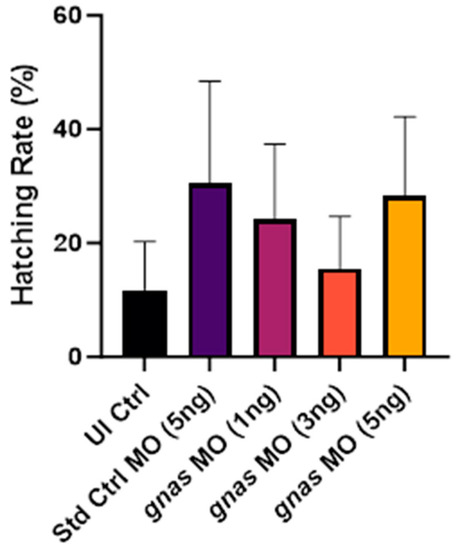
The hatching rates at 48 hpf of the zebrafish embryos ( PHENOTYPE:
|
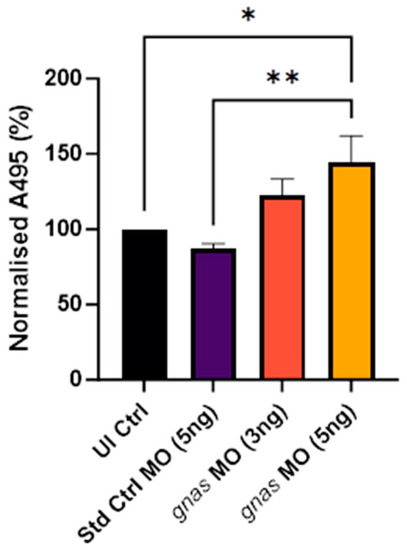
Quantification of the Oil Red O staining at 120 hpf of whole zebrafish larvae ( PHENOTYPE:
|
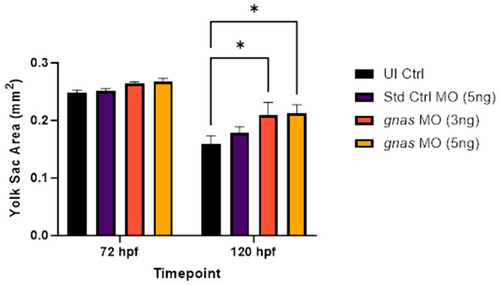
Yolk sac areas of zebrafish larvae ( PHENOTYPE:
|
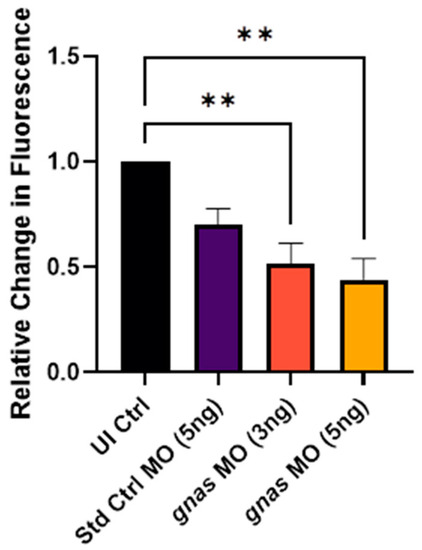
Relative change in fluorescence after incubation in alamarBlueTM assay buffer of zebrafish larvae injected with 5 ng of Std Ctrl MO or two doses (3 or 5 ng) of PHENOTYPE:
|
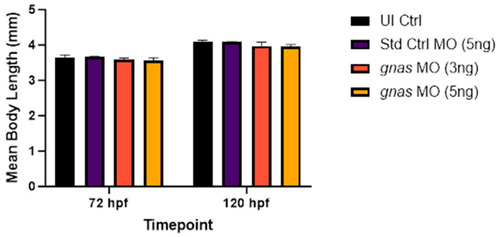
The mean body lengths of zebrafish larvae ( PHENOTYPE:
|
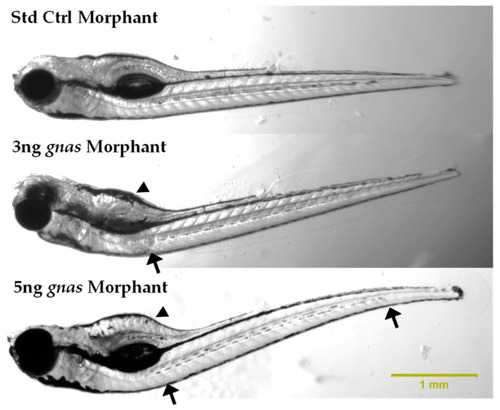
Representative images of the lateral views of standard control and PHENOTYPE:
|
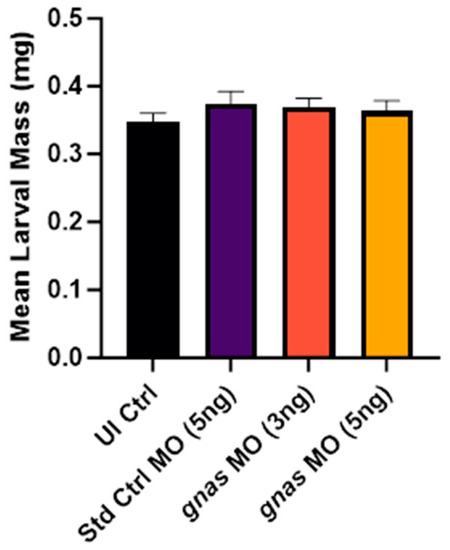
The mean larval masses of zebrafish larvae ( PHENOTYPE:
|
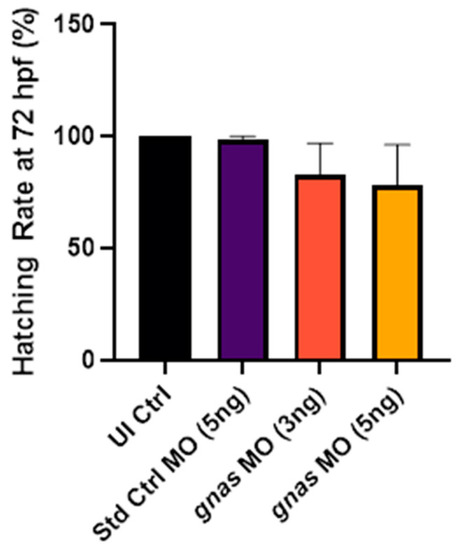
Hatching rates at 72 hpf of zebrafish larvae ( PHENOTYPE:
|
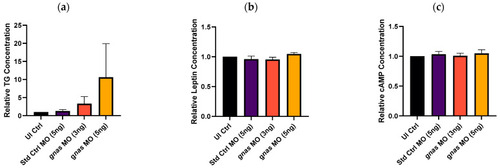
Concentrations of different molecules in whole zebrafish larvae at 72 hpf, determined by ELISA. ( PHENOTYPE:
|