
Image
|
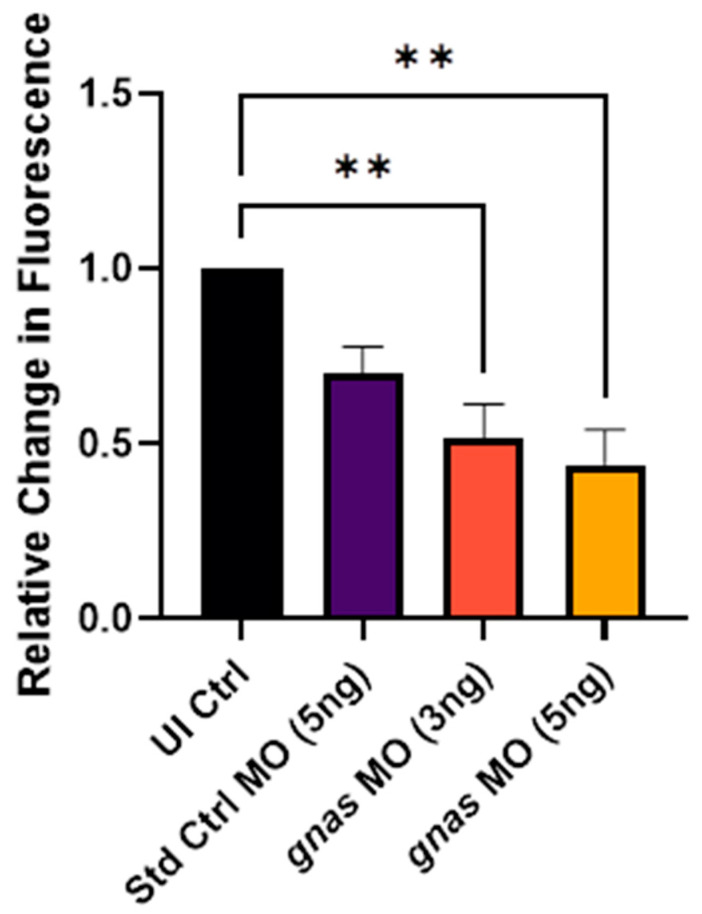
Figure Caption
Figure 8
Relative change in fluorescence after incubation in alamarBlueTM assay buffer of zebrafish larvae injected with 5 ng of Std Ctrl MO or two doses (3 or 5 ng) of
Figure Data
Acknowledgments
This image is the copyrighted work of the attributed author or publisher, and
ZFIN has permission only to display this image to its users.
Additional permissions should be obtained from the applicable author or publisher of the image.
Full text @ Int. J. Mol. Sci.