IMAGE

Figure 1

ID
ZDB-IMAGE-241219-98
Antibodies
Source
Figures for Abbas et al., 2024
Image
Figure Caption

Figure 1

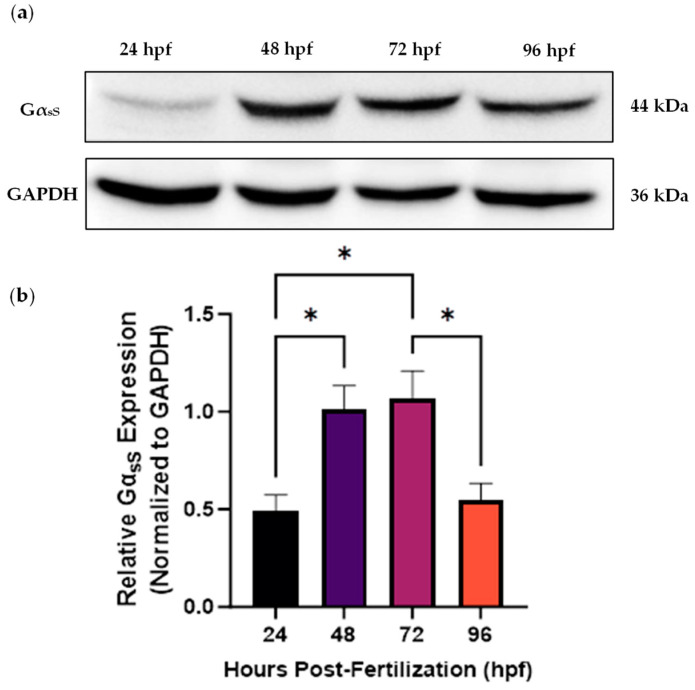
Western blot analysis of the temporal expression pattern of the short Gαs isoform (GαsS) in whole wild-type zebrafish from 24 to 96 h post-fertilization (hpf). (a) Representative blot of the GαsS expression level using GAPDH as a loading control. Whole zebrafish tissue lysates were used to extract total protein (~40 µg loaded per well). (b) The band intensities were quantified using ImageJ software, followed by normalization of the GαsS band intensity to that of GAPDH, yielding the relative GαsS expression level in arbitrary units. One-way ANOVA followed by Tukey’s multiple comparisons test were performed (* p < 0.05). Each bar represents the mean ± SEM (n = 3).

Figure Data
Acknowledgments
This image is the copyrighted work of the attributed author or publisher, and ZFIN has permission only to display this image to its users. Additional permissions should be obtained from the applicable author or publisher of the image. Full text @ Int. J. Mol. Sci.