
FIGURE
Figure 7
- ID
- ZDB-FIG-241219-78
- Publication
- Abbas et al., 2024 - gnas Knockdown Induces Obesity and AHO Features in Early Zebrafish Larvae
- Other Figures
- All Figure Page
- Back to All Figure Page
Figure 7
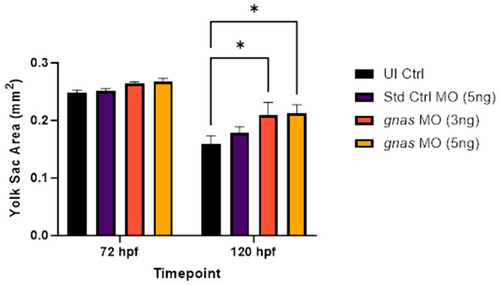
Yolk sac areas of zebrafish larvae ( |
Expression Data
Expression Detail
Antibody Labeling
Phenotype Data
| Fish: | |
|---|---|
| Knockdown Reagents: | |
| Observed In: | |
| Stage Range: | Protruding-mouth to Day 5 |
Phenotype Detail
Acknowledgments
This image is the copyrighted work of the attributed author or publisher, and
ZFIN has permission only to display this image to its users.
Additional permissions should be obtained from the applicable author or publisher of the image.
Full text @ Int. J. Mol. Sci.