IMAGE

Figure 2

ID
ZDB-IMAGE-241219-106
Antibodies
Source
Figures for Abbas et al., 2024
Image
Figure Caption

Figure 2

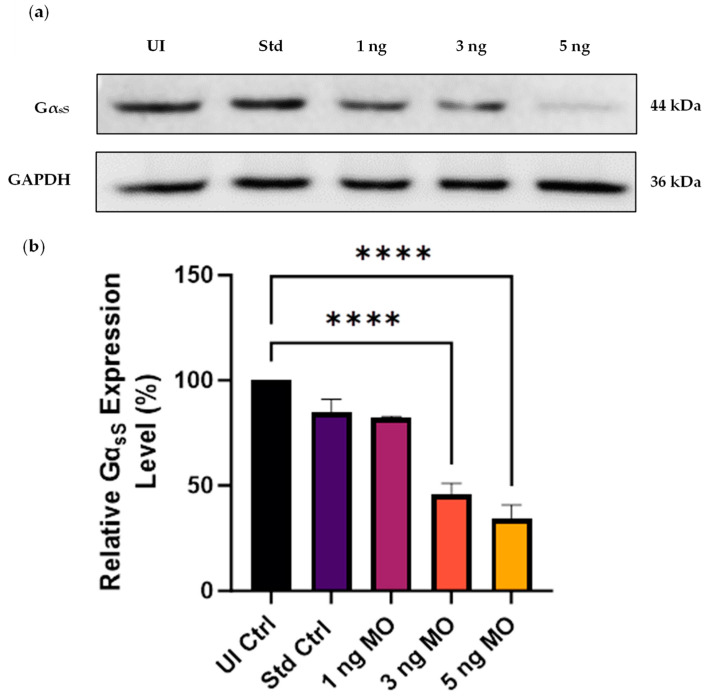
Western blot analysis of the knockdown efficiency of the three gnas Morpholino (MO) doses at 48 hpf. (a) Representative blot of the GαsS expression level in non-injected control (UI Ctrl) and standard control (Std Ctrl) embryos compared to those injected with 1, 3, and 5 ng of gnas MOs. The Std Ctrl embryos were injected with 5 ng of Std Ctrl MO. Whole zebrafish tissue lysates were used to extract total protein (~40 µg loaded per well) and GAPDH served as a loading control. (b) The band intensities were quantified using ImageJ software, followed by normalization of the GαsS band intensity to that of GAPDH. The GαsS expression level was expressed as a percentage of that in the UI Ctrl embryos. One-way ANOVA followed by Tukey’s multiple comparisons test were performed (**** p < 0.0001). Each bar represents the mean ± SEM (n = 4).

Figure Data
Acknowledgments
This image is the copyrighted work of the attributed author or publisher, and ZFIN has permission only to display this image to its users. Additional permissions should be obtained from the applicable author or publisher of the image. Full text @ Int. J. Mol. Sci.