FIGURE SUMMARY
Title

Axon demyelination and degeneration in a zebrafish spastizin model of hereditary spastic paraplegia

Authors
Garg, V., André, S., Heyer, L., Kracht, G., Ruhwedel, T., Scholz, P., Ischebeck, T., Werner, H.B., Dullin, C., Engelmann, J., Möbius, W., Göpfert, M.C., Dosch, R., Geurten, B.R.H.
Source
Full text @ Open Biol.

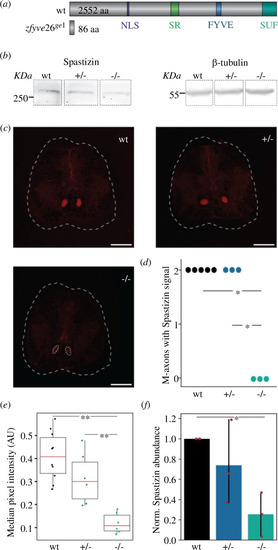
Effects of CRISPR-Cas9 mediated gene editing on Spastizin abundance. (a) A four-basepair deletion in the second exon of zfyve26 leads to a frameshift mutation that introduces a premature stop codon after 86 amino acids. (b) Immunoblotting of brain tissue, showing reduced levels of Spastizin protein in the homozygous mutants. β-tubulin is used as the loading control. Complete gel is shown in electronic supplementary material, figure S4. (c) Representative images of the immunohistochemical analysis of the sections of the spinal cord using anti-Spastizin primary antibody and donkey anti-rabbit Cyanine Dye 3 (Cy3) secondary antibody. The white dashed lines mark the section of the spinal cord. The red area illustrates the Mauthner axons with Spastizin abundance. Although Spastizin was abundant in both the axons in wild-type and heterozygous mutant fish, its abundance was significantly reduced in the axons in homozygous mutants, marked by the white-dashed circles (scale bar: 100 µm). (d) Quantification for the number of Mauthner axons having a signal for Spastizin in each genotype. The dots represent the number of animals examined from each genotype. (e) Box plot of the median pixel intensity of the Spastizin signal in the two M-cell axons, normalized to the maximum intensity. The red line represents the median of all values, the box displays the upper and lower quartile, the whiskers denote 1.5 times the interquartile range and the dots show individual data points. There is a significant reduction of the signal intensity for Spastizin in the M-cell axons of homozygous mutants compared to both heterozygous and wild-type fish (no. of fish: wt = 5, +/− = 3, −/− = 3). (f) The bar graph shows the relative abundance of Spastizin protein, normalized to anti-β-tubulin, between the three genotypes. Data are depicted as mean and variance, with red dots representing the individual data points. There is a significant decrease in the abundance of 1S2pastizin in the brain of mutant fish compared to the wild-type (no. of biological replicates = 3). Statistical significance was tested with an ANOVA followed by Tukey’s HSD for post hoc comparisons of Spastizin abundance and by Fisher’s permutation test for the number of M-cell axons with Spastizin signal and its intensity in the M-cell axons. *p < 0.05, **p < 0.01.

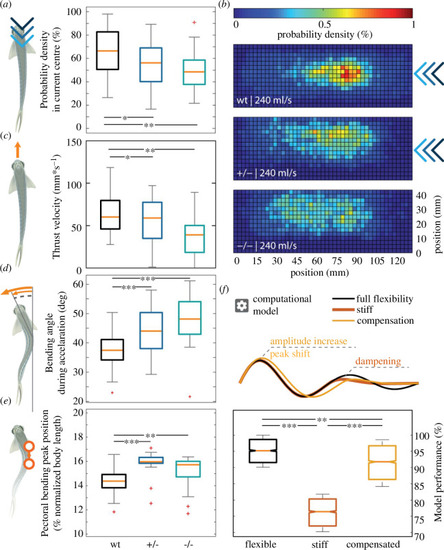
Locomotion defects observed in spastizin mutants during unmotivated and counter-current trials. Data are represented as box plots for assessing various aspects of locomotive ability of wild-type and spastizin mutants. The orange line shows the median of all individuals, the box displays the upper and lower quartile, the whiskers denote 1.5 times the interquartile range, the plus-sign marks outlier. (a) The homozygous mutants spend less time in the centre of the water current as compared to heterozygous and wild-type fish. (b) Each histogram is normalized to 100% and the colour bar goes from 0 to1%. The heat map shows all possible locations of the fish in the setup. Blue colour indicates low probability and red colour illustrates high probability of presence. Whereas the spastizin mutants are more dispersed within the setup, the wild-type fish stay more at the centre, where the current is most constant. (c) Decrease in the median thrust velocity of homozygous spastizin mutants as compared to heterozygous and wild-type fish during unmotivated trials. (d) Increase in the bending angle for both heterozygous and homozygous mutants compared to wild-types. (e) Increase in pectoral bending peak position (normalized to body length) of heterozygous and homozygous mutants compared to wild-types. (f) Computational model depicting a shift in the peak position of pectoral standing wave, which compensates for the dampened travelling wave. The box plot shows the model performance with fully flexible and compensated at the same level and high as compared to the stiff (no. of fish: wt = 53, +/− = 23, −/− = 21). Statistical significance was tested with Fisher’s permutation test. *p < 0 .05, **p < 0.01, ***p < 0.001.

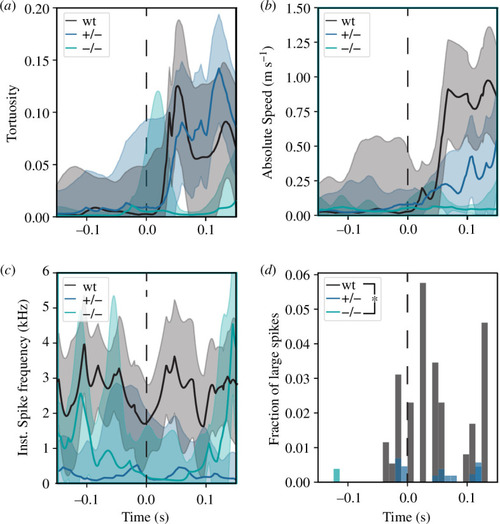
Lack of Spastizin affects the function of M-cells. (a) shows the tortuosity of the zebrafish over time as median with the surrounding 95% confidence interval. Tortuosity is defined as the difference in the body length and the distance between the head and tail of the animal, normalized to the body length. A value of 0 signifies the animal is entirely straight and 1 tortuosity signifies that head and tail touch. (b) presents the absolute velocity during the same time window. (c) shows the instantaneous spike frequency over time, as in (a) The dashed vertical line marks the time of the stimulus presentation. (d) shows the mean histogram of the occurrence of large spikes during the same time window. All three parameters are low for homozygous mutants compared to heterozygous and wild-types (no. of fish: wt = 9, +/− = 18, −/− = 5). Statistical significance was tested with Fisher’s permutation test (*p < 0.05) and showed a significant reduction in large spikes in mutants compared to wild-type animals.

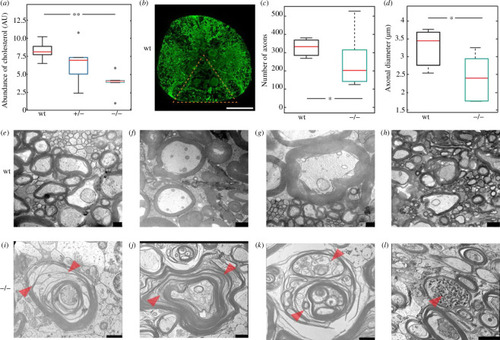
Degeneration and demyelination of the spinal cord motor neuron axons of the spastizin mutants. (a) Data are represented as box plots for the abundance of cholesterol in the brain of wild-type and spastizin mutant fish, divided by the mass of the sample and normalized to the internal standard. The red line depicts the median, the box displays the upper and lower quartile and the whiskers denote 1.5 times the inter quartile distance. Black circle marks outlier. There is a significant reduction in the abundance of cholesterol in the brain of homozygous mutants compared to the wild-types (no. of fish: wt = 5, +/− = 5, −/− = 5). (b) Representative image of immunohistochemical analysis of spinal cord cross sections stained with a neuronal marker anti-β-tubulin. The triangle marks the area in which the number and diameter of axons were quantified (scale bar: 100 µm). (c,d) Data are represented as box plots for number and diameter of axons in the evenly distributed sections of the spinal cord for wild-type and mutant zebrafish. The red line depicts the median, the box displays the upper and lower quartile and the whiskers denote 1.5 times the inter quartile distance. There is a significant decrease in the number and diameter of axons in the spastizin mutants compared to the wild-types (no. of fish: wt = 3, −/− = 6). (e–l) Representative images of the cross-section of the spinal cord showing large-calibre axons surrounded with myelin sheath (no. of fish: wt = 1, −/− = 2). (e,f,g,h) Representative images of intact myelin sheath in the wild-type fish. (I,g) Arrowheads mark fragmentation or splitting of myelin sheath in the homozygous mutants. (k) Severe vesiculation profile of myelin sheath marked by arrowheads, in homozygous mutants. (l) Arrowhead indicates swelling in large-calibre axons of the spinal cord of homozygous spastizin mutants. Scale bars: 250 nm in (e,g), 1 µm in (f,h,i,k) and 2 µm in (j,l). Statistical significance was tested with Wilcoxon rank-sum test for cholesterol abundance and with Fisher’s permutation test for the number and diameter of axons *p < 0.05 and **p < 0.01.

Acknowledgments
This image is the copyrighted work of the attributed author or publisher, and ZFIN has permission only to display this image to its users. Additional permissions should be obtained from the applicable author or publisher of the image. Full text @ Open Biol.