IMAGE

Figure 1.

ID
ZDB-IMAGE-241114-9
Source
Figures for Garg et al., 2024
Image
Figure Caption

Figure 1.

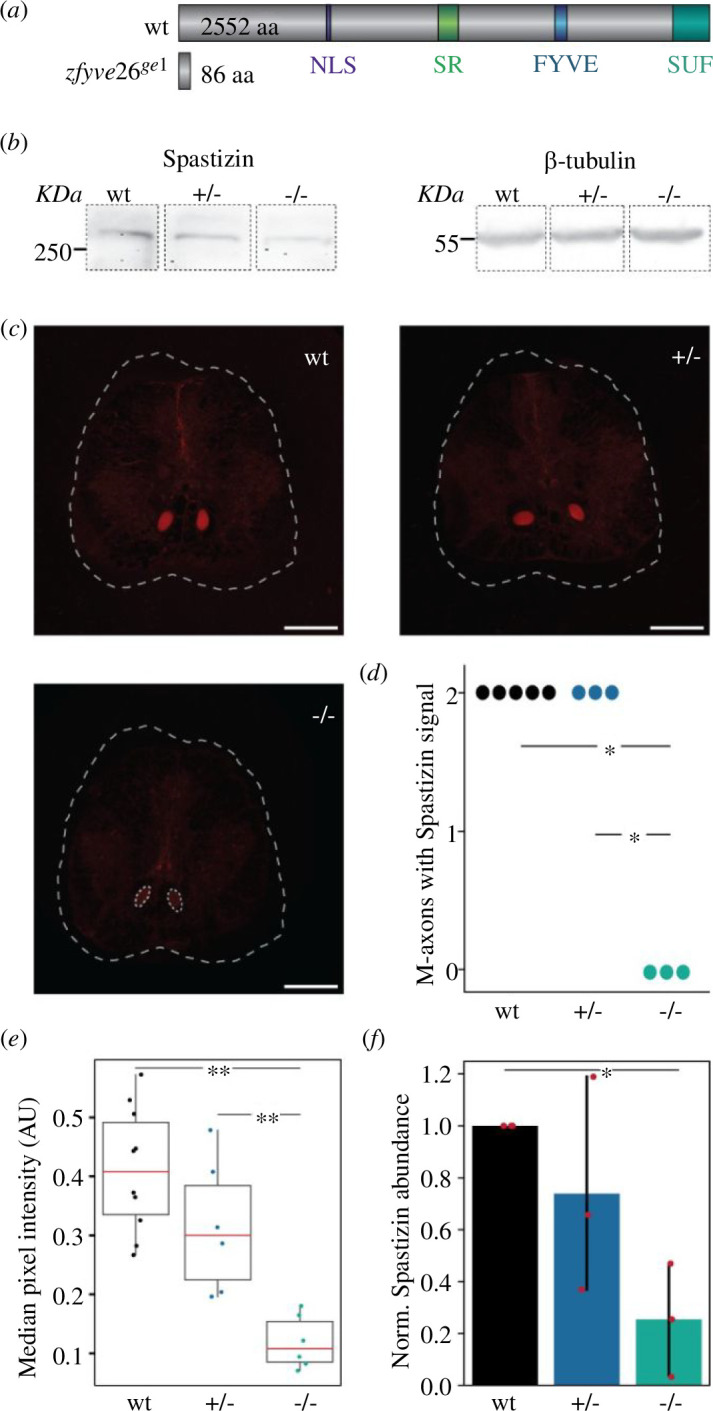
Effects of CRISPR-Cas9 mediated gene editing on Spastizin abundance. (a) A four-basepair deletion in the second exon of zfyve26 leads to a frameshift mutation that introduces a premature stop codon after 86 amino acids. (b) Immunoblotting of brain tissue, showing reduced levels of Spastizin protein in the homozygous mutants. β-tubulin is used as the loading control. Complete gel is shown in electronic supplementary material, figure S4. (c) Representative images of the immunohistochemical analysis of the sections of the spinal cord using anti-Spastizin primary antibody and donkey anti-rabbit Cyanine Dye 3 (Cy3) secondary antibody. The white dashed lines mark the section of the spinal cord. The red area illustrates the Mauthner axons with Spastizin abundance. Although Spastizin was abundant in both the axons in wild-type and heterozygous mutant fish, its abundance was significantly reduced in the axons in homozygous mutants, marked by the white-dashed circles (scale bar: 100 µm). (d) Quantification for the number of Mauthner axons having a signal for Spastizin in each genotype. The dots represent the number of animals examined from each genotype. (e) Box plot of the median pixel intensity of the Spastizin signal in the two M-cell axons, normalized to the maximum intensity. The red line represents the median of all values, the box displays the upper and lower quartile, the whiskers denote 1.5 times the interquartile range and the dots show individual data points. There is a significant reduction of the signal intensity for Spastizin in the M-cell axons of homozygous mutants compared to both heterozygous and wild-type fish (no. of fish: wt = 5, +/− = 3, −/− = 3). (f) The bar graph shows the relative abundance of Spastizin protein, normalized to anti-β-tubulin, between the three genotypes. Data are depicted as mean and variance, with red dots representing the individual data points. There is a significant decrease in the abundance of 1S2pastizin in the brain of mutant fish compared to the wild-type (no. of biological replicates = 3). Statistical significance was tested with an ANOVA followed by Tukey’s HSD for post hoc comparisons of Spastizin abundance and by Fisher’s permutation test for the number of M-cell axons with Spastizin signal and its intensity in the M-cell axons. *p < 0.05, **p < 0.01.

Acknowledgments
This image is the copyrighted work of the attributed author or publisher, and ZFIN has permission only to display this image to its users. Additional permissions should be obtained from the applicable author or publisher of the image. Full text @ Open Biol.