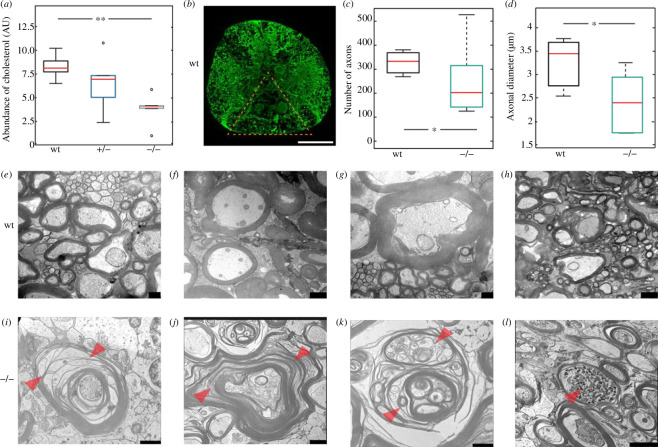
Degeneration and demyelination of the spinal cord motor neuron axons of the spastizin mutants. (a) Data are represented as box plots for the abundance of cholesterol in the brain of wild-type and spastizin mutant fish, divided by the mass of the sample and normalized to the internal standard. The red line depicts the median, the box displays the upper and lower quartile and the whiskers denote 1.5 times the inter quartile distance. Black circle marks outlier. There is a significant reduction in the abundance of cholesterol in the brain of homozygous mutants compared to the wild-types (no. of fish: wt = 5, +/− = 5, −/− = 5). (b) Representative image of immunohistochemical analysis of spinal cord cross sections stained with a neuronal marker anti-β-tubulin. The triangle marks the area in which the number and diameter of axons were quantified (scale bar: 100 µm). (c,d) Data are represented as box plots for number and diameter of axons in the evenly distributed sections of the spinal cord for wild-type and mutant zebrafish. The red line depicts the median, the box displays the upper and lower quartile and the whiskers denote 1.5 times the inter quartile distance. There is a significant decrease in the number and diameter of axons in the spastizin mutants compared to the wild-types (no. of fish: wt = 3, −/− = 6). (e–l) Representative images of the cross-section of the spinal cord showing large-calibre axons surrounded with myelin sheath (no. of fish: wt = 1, −/− = 2). (e,f,g,h) Representative images of intact myelin sheath in the wild-type fish. (I,g) Arrowheads mark fragmentation or splitting of myelin sheath in the homozygous mutants. (k) Severe vesiculation profile of myelin sheath marked by arrowheads, in homozygous mutants. (l) Arrowhead indicates swelling in large-calibre axons of the spinal cord of homozygous spastizin mutants. Scale bars: 250 nm in (e,g), 1 µm in (f,h,i,k) and 2 µm in (j,l). Statistical significance was tested with Wilcoxon rank-sum test for cholesterol abundance and with Fisher’s permutation test for the number and diameter of axons *p < 0.05 and **p < 0.01.
Acknowledgments
This image is the copyrighted work of the attributed author or publisher, and
ZFIN has permission only to display this image to its users.
Additional permissions should be obtained from the applicable author or publisher of the image.
Full text @ Open Biol.
Your Input Welcome
Thank you for submitting comments. Your input has been emailed to ZFIN curators who may contact you if
additional information is required.
Oops. Something went wrong. Please try again later.