FIGURE SUMMARY
Title

Deletion of Slc1a4 Suppresses Single Mauthner Cell Axon Regeneration In Vivo through Growth-Associated Protein 43

Authors
Li, K., Fan, D., Zhou, J., Zhao, Z., Han, A., Song, Z., Tang, X., Hu, B.
Source
Full text @ Int. J. Mol. Sci.

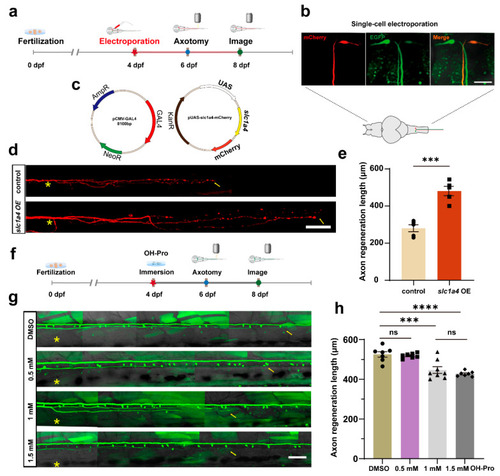
Overexpression of slc1a4 in Mauthner cells promotes axon regeneration in vivo. (a) Timeline of time points of electroporation, axotomy, and imaging. (b) Pattern diagram of electroporation and confocal images of positive expression in M-cells; three photos represent position of M-cell under 40× magnification. Scale bar, 50 μm (EGFP: labeled M-cells in Tol-056 zebrafish strain; mCherry: fluorescent reporter gene in foreign plasmid). (c) Schematic diagram of microinjection using two-plasmid system. (d) Representative diagram of confocal imaging of M-cells’ axon regeneration. Asterisk, ablation site; Arrow, regeneration endpoint location. scale bar, 50 μm (control: control; slc1a4 OE: overexpression). (e) Statistical quantitative diagram of axon regeneration. Data shown as mean ± sem (control: 280.0 ± 18.8 μm, n = 5; slc1a4 OE: 452.8 ± 34.0 μm, n = 5). Assessed by unpaired, two-tailed Student’s t-test. *** p < 0.001. (f) Timing of inhibitor processing, laser damage, and imaging. (g) Representative diagram of confocal imaging of M-cells’ axon regeneration between DMSO and inhibitor (concentration gradient, OH-Pro: 0.5 mM, 1 mM, 1.5 mM). Asterisk: ablation site. Arrowhead: axon regeneration terminal; scale bar, 50 μm. (h) Statistical quantitative diagram of axon regeneration. Data shown as mean ± sem (DMSO: 525.6 ± 13.9 μm, n = 7; 0.5 mM: 519.0 ± 4.6 μm, n = 7; 1 mM: 446.9 ± 17.0 μm, n = 8; 1.5 mM: 427.3 ± 4.879 μm, n = 7); data were analyzed with one-way ANOVA. *** p < 0.001; **** p < 0.0001; ns, not significant.

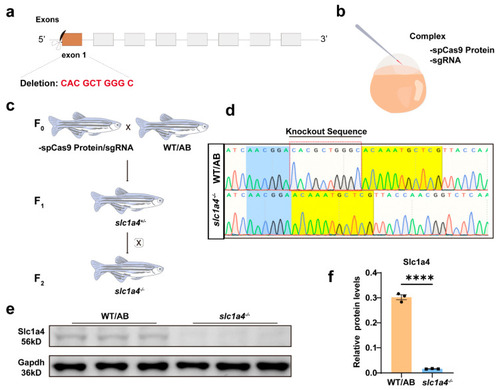
Identification of slc1a4 mutant zebrafish. (a) Schematic of Cas9-sgRNA targeted site located in first exon of slc1a4. (b) Schematic of complex injected into one-cell embryos. (c) Procedure for obtaining slc1a4−/− mutant lines. (d) Representative sequencing results of wild-type and mutated zebrafish lines. Mutant sequencing results showed that 10 bp were deleted in slc1a4−/− zebrafish. (e,f) Western blotting analysis showed that Slc1a4 protein expression is inhibited in mutant group compared with wild type. Protein expressions were quantified by Image J software version 1.54f. Experiment was repeated three times with three independent samples. **** p < 0.0001. Assessed by unpaired t-test.

EXPRESSION / LABELING:
Antibody:
Fish:
Anatomical Term:
Stage: Day 4
PHENOTYPE:
Fish:
Observed In:
Stage: Day 4

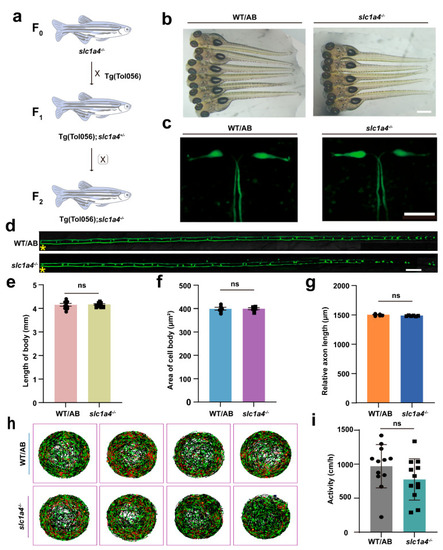
Deficiency in Slc1a4 does not affect development of M-cells and motor function of juvenile fish. (a) Hybridization of transgenic line: Tg (Tol 056: EGFP) and slc1a4 mutants were crossed for two consecutive generations to obtain Tg (Tol 056: EGFP)/slc1a4+/− and Tg (T056: EGFP); slc1a4−/− lines. (b) Representative images of embryos from wild type and mutant at 6 dpf (scale bar, 500 μm). (c) Representative images of area of cell body (scale bar, 50 μm). (d) Representative images of relative axon length from cloacal pore to end (scale bar, 50 μm). Asterisk, ablation site. (e) Statistical quantitative diagram represents length of fish at 6 dpf. Data shown as mean ± sem (WT/AB: 4.1 ± 0.1 mm, n = 9; slc1a4−/−: 4.2 ± 0.0 mm, n = 10). Assessed by unpaired t-test. ns, not significant. (f) Statistical quantitative diagram represents area of cell body. Data shown as mean ± sem (WT/AB: 399.3 ± 5.9 μm2, n = 6; slc1a4−/−: 399.7 ± 3.9 μm2, n = 6). Assessed by unpaired t-test. ns, not significant. (g) Statistical quantitative diagram represents relative axon length. Data shown as mean ± sem (WT/AB: 1498.0 ± 6.1 μm, n = 6; slc1a4−/−: 1485.0 ± 3.0 μm, n = 6). Assessed by unpaired t-test. ns, not significant. (h,i) Line illustrates 6 dpf zebrafish larvae’s swimming trajectory differences from WT and slc1a4−/− groups evaluated over 1 h. Data shown as mean ± sem (WT/AB: 1230.0 ± 70.1 cm/h, n = 6; slc1a4−/−: 844.2 ± 58.0 cm/h, n = 12). Assessed by unpaired t-test. ns, not significant.

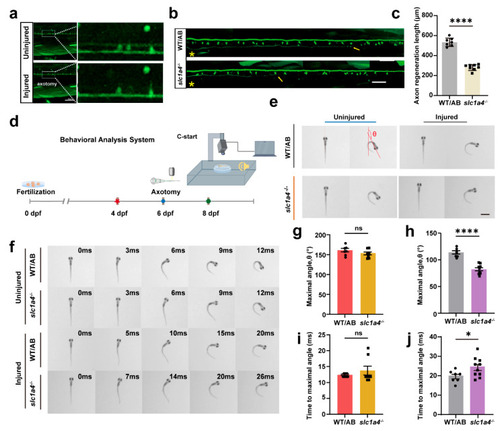
Deficiency in Slc1a4 suppresses Mauthner cell axon regeneration and relative function in vivo. (a) Representative images of confocal imaging of M-cell axon before and after ablation by two-photon laser above cloacal pore (scale bar, 50 μm). (b,c) Representative diagram of confocal imaging of M-cells’ axon regeneration between WT and slc1a4−/−. Data shown as mean ± sem. Scale bar, 50 μm. Assessed by unpaired t-test. **** p < 0.0001. Asterisk, ablation site; Arrow, regeneration endpoint location. (d) Device for testing escape behavior. (e) Representative images of original orientation and maximal turn angle position from WT and slc1a4−/− zebrafish larvae in uninjured and injured groups. Red lines indicate heading direction. (f) Series of images of movement trajectory from WT and slc1a4−/− zebrafish larvae in uninjured and injured groups. (g,h) Statistical diagram of maximal turn angle, θ. Data shown as mean ± sem. Uninjured: ns, not significant (WT/AB: 161.2 ± 11.89°, n = 7; slc1a4−/−: 152.9 ± 10.36°, n = 8); injured: **** p < 0.0001 (WT/AB: 113.9 ± 3.1°, n = 7; slc1a4−/−: 82.36 ± 2.917°, n = 10). ns, not significant. Scale bar, 1 mm. Assessed by unpaired t-test. (i,j) Statistical diagram of time to maximal turn angle. Data shown as mean ± sem. Uninjured, ns, not significant (WT/AB: 12.4 ± 0.2 ms, n = 7; slc1a4−/−: 13.75 ± 1.386 ms, n = 8); injured, * p < 0.05 (WT/AB: 19.86 ± 1.143 ms, n = 7; slc1a4−/−: 24.50 ± 1.586 ms, n = 10); ns, not significant; * p < 0.05. Assessed by unpaired t-test.

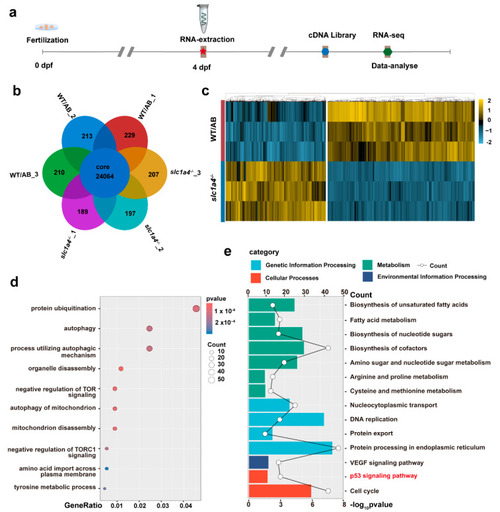
RNA-seq revealed that Slc1a4 may influence regeneration of Mauthner axons through P53 signal pathway. (a) Timeline of time points of RNA extraction and RNA-seq. (b,c) Heatmap shows downregulated and upregulated genes in slc1a4 mutant zebrafish (downregulated genes: 2509; upregulated genes: 1863). (d) GO enrichment analysis of upregulated genes. (e) Enrichment for KEGG pathway analysis of downregulated genes.

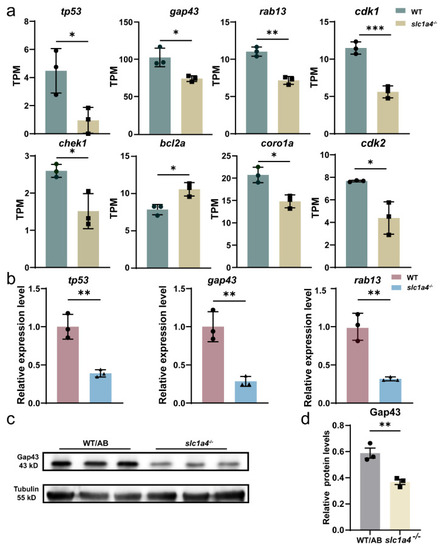
Slc1a4 deletion may inhibit Mauthner axons’ regeneration via Gap43 suppression. (a) RNA-seq analysis of P53 signaling pathway-related gene expression in mutant and wild-type lines. TPMs: Transcripts Per Kilobase of exon model per Million mapped reads. Assessed by unpaired t-test. * p < 0.05. ** p < 0.01. *** p < 0.001 (b) qPCR detection of tp53 and gap43 and rab13 expression. ** p < 0.01. (c,d) Gap43 was decreased in knockout group as shown via Western blot quantification. Data shown as mean ± sem. Unpaired Student’s two-tailed t-test; ** p < 0.01.

EXPRESSION / LABELING:
Genes:
Fish:
Anatomical Term:
Stage: Day 6
PHENOTYPE:
Fish:
Observed In:
Stage: Day 6
Acknowledgments
This image is the copyrighted work of the attributed author or publisher, and ZFIN has permission only to display this image to its users. Additional permissions should be obtained from the applicable author or publisher of the image. Full text @ Int. J. Mol. Sci.