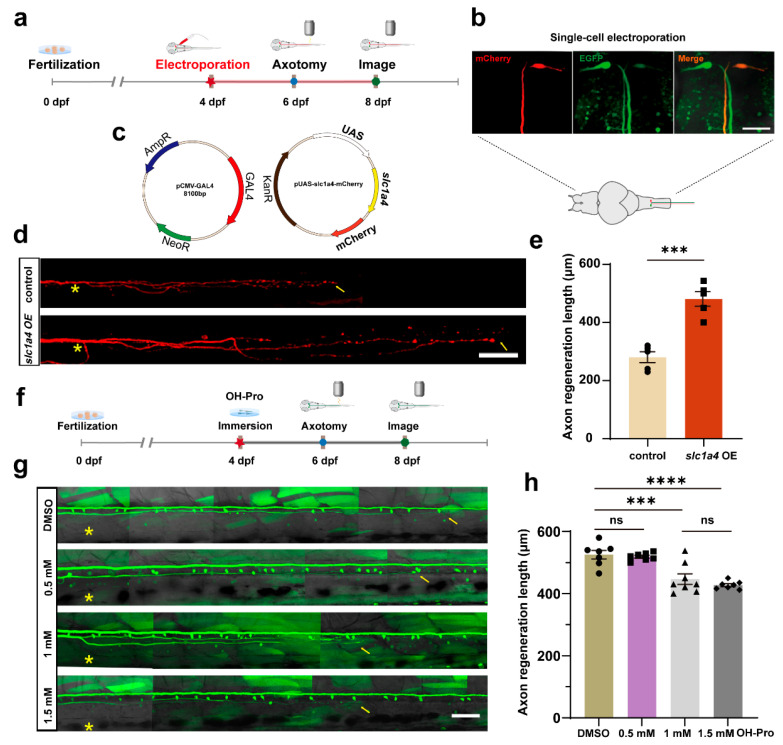
Overexpression of slc1a4 in Mauthner cells promotes axon regeneration in vivo. (a) Timeline of time points of electroporation, axotomy, and imaging. (b) Pattern diagram of electroporation and confocal images of positive expression in M-cells; three photos represent position of M-cell under 40× magnification. Scale bar, 50 μm (EGFP: labeled M-cells in Tol-056 zebrafish strain; mCherry: fluorescent reporter gene in foreign plasmid). (c) Schematic diagram of microinjection using two-plasmid system. (d) Representative diagram of confocal imaging of M-cells’ axon regeneration. Asterisk, ablation site; Arrow, regeneration endpoint location. scale bar, 50 μm (control: control; slc1a4 OE: overexpression). (e) Statistical quantitative diagram of axon regeneration. Data shown as mean ± sem (control: 280.0 ± 18.8 μm, n = 5; slc1a4 OE: 452.8 ± 34.0 μm, n = 5). Assessed by unpaired, two-tailed Student’s t-test. *** p < 0.001. (f) Timing of inhibitor processing, laser damage, and imaging. (g) Representative diagram of confocal imaging of M-cells’ axon regeneration between DMSO and inhibitor (concentration gradient, OH-Pro: 0.5 mM, 1 mM, 1.5 mM). Asterisk: ablation site. Arrowhead: axon regeneration terminal; scale bar, 50 μm. (h) Statistical quantitative diagram of axon regeneration. Data shown as mean ± sem (DMSO: 525.6 ± 13.9 μm, n = 7; 0.5 mM: 519.0 ± 4.6 μm, n = 7; 1 mM: 446.9 ± 17.0 μm, n = 8; 1.5 mM: 427.3 ± 4.879 μm, n = 7); data were analyzed with one-way ANOVA. *** p < 0.001; **** p < 0.0001; ns, not significant.
Acknowledgments
This image is the copyrighted work of the attributed author or publisher, and
ZFIN has permission only to display this image to its users.
Additional permissions should be obtained from the applicable author or publisher of the image.
Full text @ Int. J. Mol. Sci.
Your Input Welcome
Thank you for submitting comments. Your input has been emailed to ZFIN curators who may contact you if
additional information is required.
Oops. Something went wrong. Please try again later.