
- Title
-
The embryonic zebrafish brain is exclusively colonized by pu.1-dependent and lymphatic-independent population of microglia
- Authors
- Yu, T., Chen, J., Wang, Y., Xu, J.
- Source
- Full text @ Sci Adv
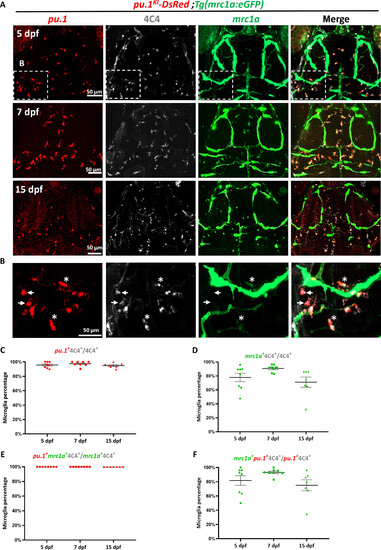
All mrc1a+ microglia express pu.1 at 5, 7, and 15 dpf. (A) Representative images of pu.1KI-DsRed;Tg(mrc1a:eGFP) embryos stained with DsRed, 4C4, and enhanced green fluorescent protein (eGFP) antibodies at 5, 7, and 15 dpf. (B) Magnified images of the white boxed region in (A). White arrows indicated the pu.1+4C4+mrc1a? microglia. Asterisks indicated the pu.1+4C4+mrc1a+ microglia. (C) Percentage of pu.1+4C4+ microglia in all 4C4+ microglia at 5 dpf (n = 8), 7 dpf (n = 8), and 15 dpf (n = 7). (D) Percentage of mrc1a+4C4+ microglia in all 4C4+ microglia at 5, 7, and 15 dpf. (E) Percentage of pu.1+mrc1a+4C4+ microglia in all mrc1a+4C4+ microglia at 5, 7, and 15 dpf. (F) Percentage of mrc1a+pu.1+4C4+ microglia in all pu.1+4C4+ microglia at 5, 7, and 15 dpf. Error bars represent � SEM. |
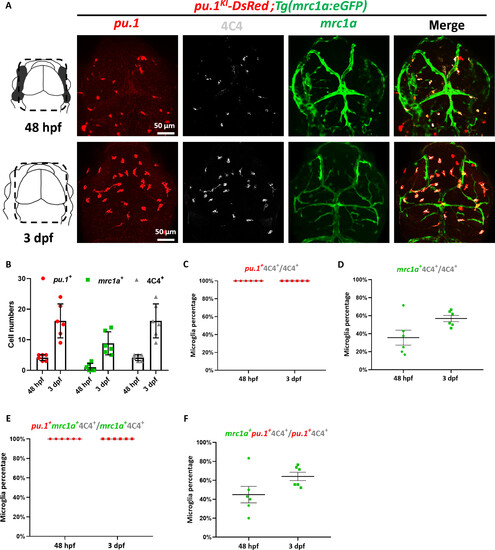
Characterization of pu.1+mrc1a+ microglia at 48 hpf and 3 dpf. (A) Schematic diagram of imaging region and representative images of pu.1KI-DsRed; Tg (mrc1a: eGFP) embryos stained with DsRed, 4C4, and eGFP antibodies at 48 hpf and 3 dpf. (B) Quantification of pu.1+, 4C4+, and mrc1a+ cells in brain at 48 hpf (n = 6) and 3 dpf (n = 6), respectively. (C) Percentage of pu.1+4C4+ microglia in all 4C4+ microglia at 48 hpf (n = 6) and 3 dpf (n = 6). (D) Percentage of mrc1a+4C4+ microglia in all 4C4+ microglia at 48 hpf and 3 dpf. (E) Percentage of pu.1+mrc1a+4C4+ microglia in all mrc1a+4C4+ microglia at 48 hpf and 3 dpf. (F) Percentage of mrc1a+pu.1+4C4+ microglia in all pu.1+4C4+ microglia at 48 hpf and 3 dpf. Error bars represent � SEM. |

Microglia originated from macrophages instead of lyve1b+ lymphatic vessels. (A) Schematic view of lineage tracing workflow. (B) Fluorescent images show the labeling efficiency of GFP+ microglia in the brain of 5-dpf Tg(lyve1b:CreER;mpeg1:loxP-DsRedx-loxP-eGFP) and Tg(mfap4:CreER;mpeg1:loxP-DsRedx-loxP-eGFP) larvae treated with 4-hydroxytamoxifen (4-OHT) from 22 hpf to 5 dpf. (C) Fluorescent images show the labeling efficiency of GFP+ blood vessels in the brain of 5-dpf Tg(lyve1b:CreER;kdrl:loxP-DsRedx-loxP-eGFP) and Tg(mfap4:CreER;kdrl:loxP-DsRedx-loxP-eGFP) larvae treated with 4-OHT from 22 hpf to 5 dpf. |
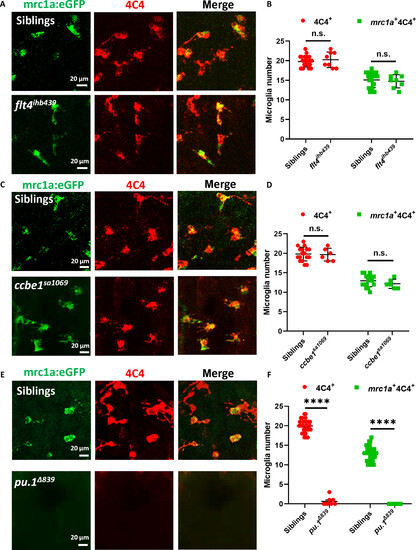
Microglia development was severely impaired in pu.1?839 mutants but remained normal in flt4ihb439 and ccbe1sa1069 mutants. (A) Representative images of 4C4+ or mrc1a+4C4+ microglia in the brain of 5-dpf siblings and flt4ihb439 mutants. (B) Quantification of 4C4+ and mrc1a+4C4+ microglia in the brain of 5-dpf siblings (n = 23) and flt4ihb439 mutants (n = 8). Error bars represent � SEM. Not significant (n.s.), P > 0.05. (C) Representative images of 4C4+ or mrc1a+4C4+ microglia in the brain of 5-dpf siblings and ccbe1sa1069 mutants. (D) Quantification of 4C4+ and mrc1a+4C4+ microglia in the brain of 5-dpf siblings (n = 17) and ccbe1sa1069 mutants (n = 6). Error bars represent � SEM. n.s., P > 0.05. (E) Representative images of 4C4+ or mrc1a+4C4+ microglia in the brain of 5-dpf siblings and pu.1?839 mutants. (F) Quantification of 4C4+ and mrc1a+4C4+ microglia in the brain of 5-dpf siblings (n = 29) and pu.1?839 mutants (n = 8). Error bars represent � SEM. ****P < 0.0001. |