
|
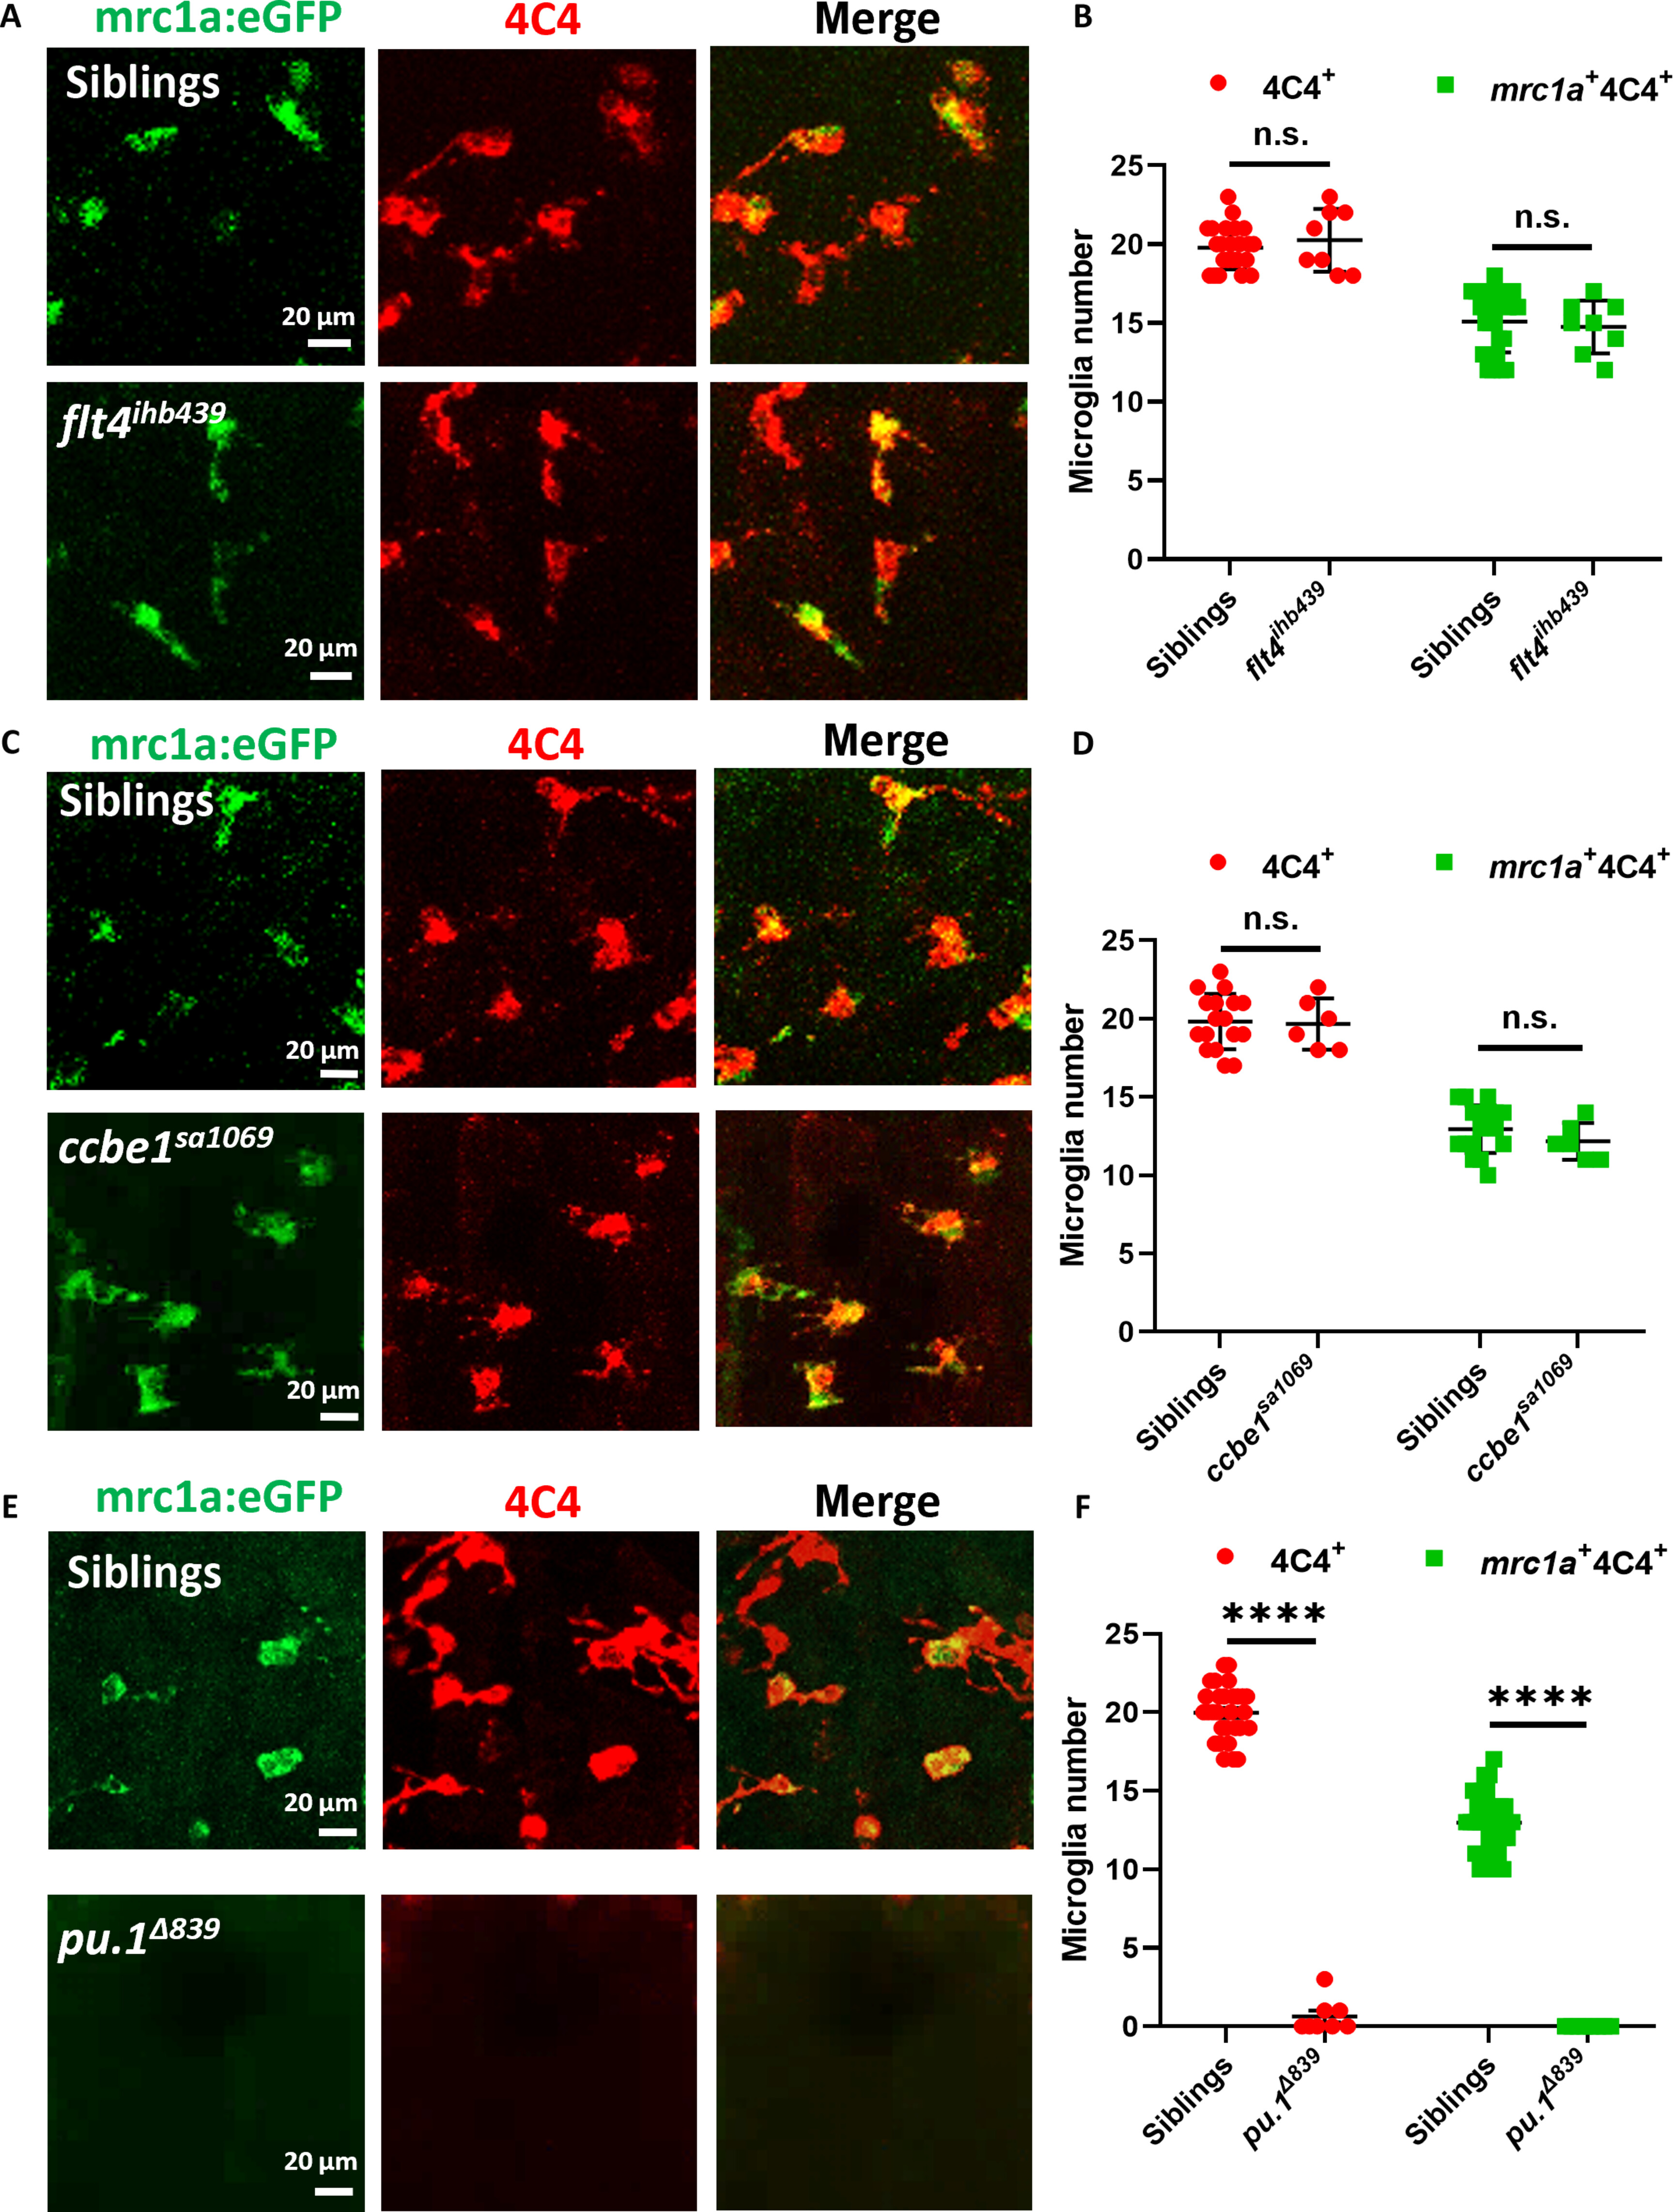
Fig. 4 Microglia development was severely impaired in pu.1?839 mutants but remained normal in flt4ihb439 and ccbe1sa1069 mutants. (A) Representative images of 4C4+ or mrc1a+4C4+ microglia in the brain of 5-dpf siblings and flt4ihb439 mutants. (B) Quantification of 4C4+ and mrc1a+4C4+ microglia in the brain of 5-dpf siblings (n = 23) and flt4ihb439 mutants (n = 8). Error bars represent � SEM. Not significant (n.s.), P > 0.05. (C) Representative images of 4C4+ or mrc1a+4C4+ microglia in the brain of 5-dpf siblings and ccbe1sa1069 mutants. (D) Quantification of 4C4+ and mrc1a+4C4+ microglia in the brain of 5-dpf siblings (n = 17) and ccbe1sa1069 mutants (n = 6). Error bars represent � SEM. n.s., P > 0.05. (E) Representative images of 4C4+ or mrc1a+4C4+ microglia in the brain of 5-dpf siblings and pu.1?839 mutants. (F) Quantification of 4C4+ and mrc1a+4C4+ microglia in the brain of 5-dpf siblings (n = 29) and pu.1?839 mutants (n = 8). Error bars represent � SEM. ****P < 0.0001.