
|
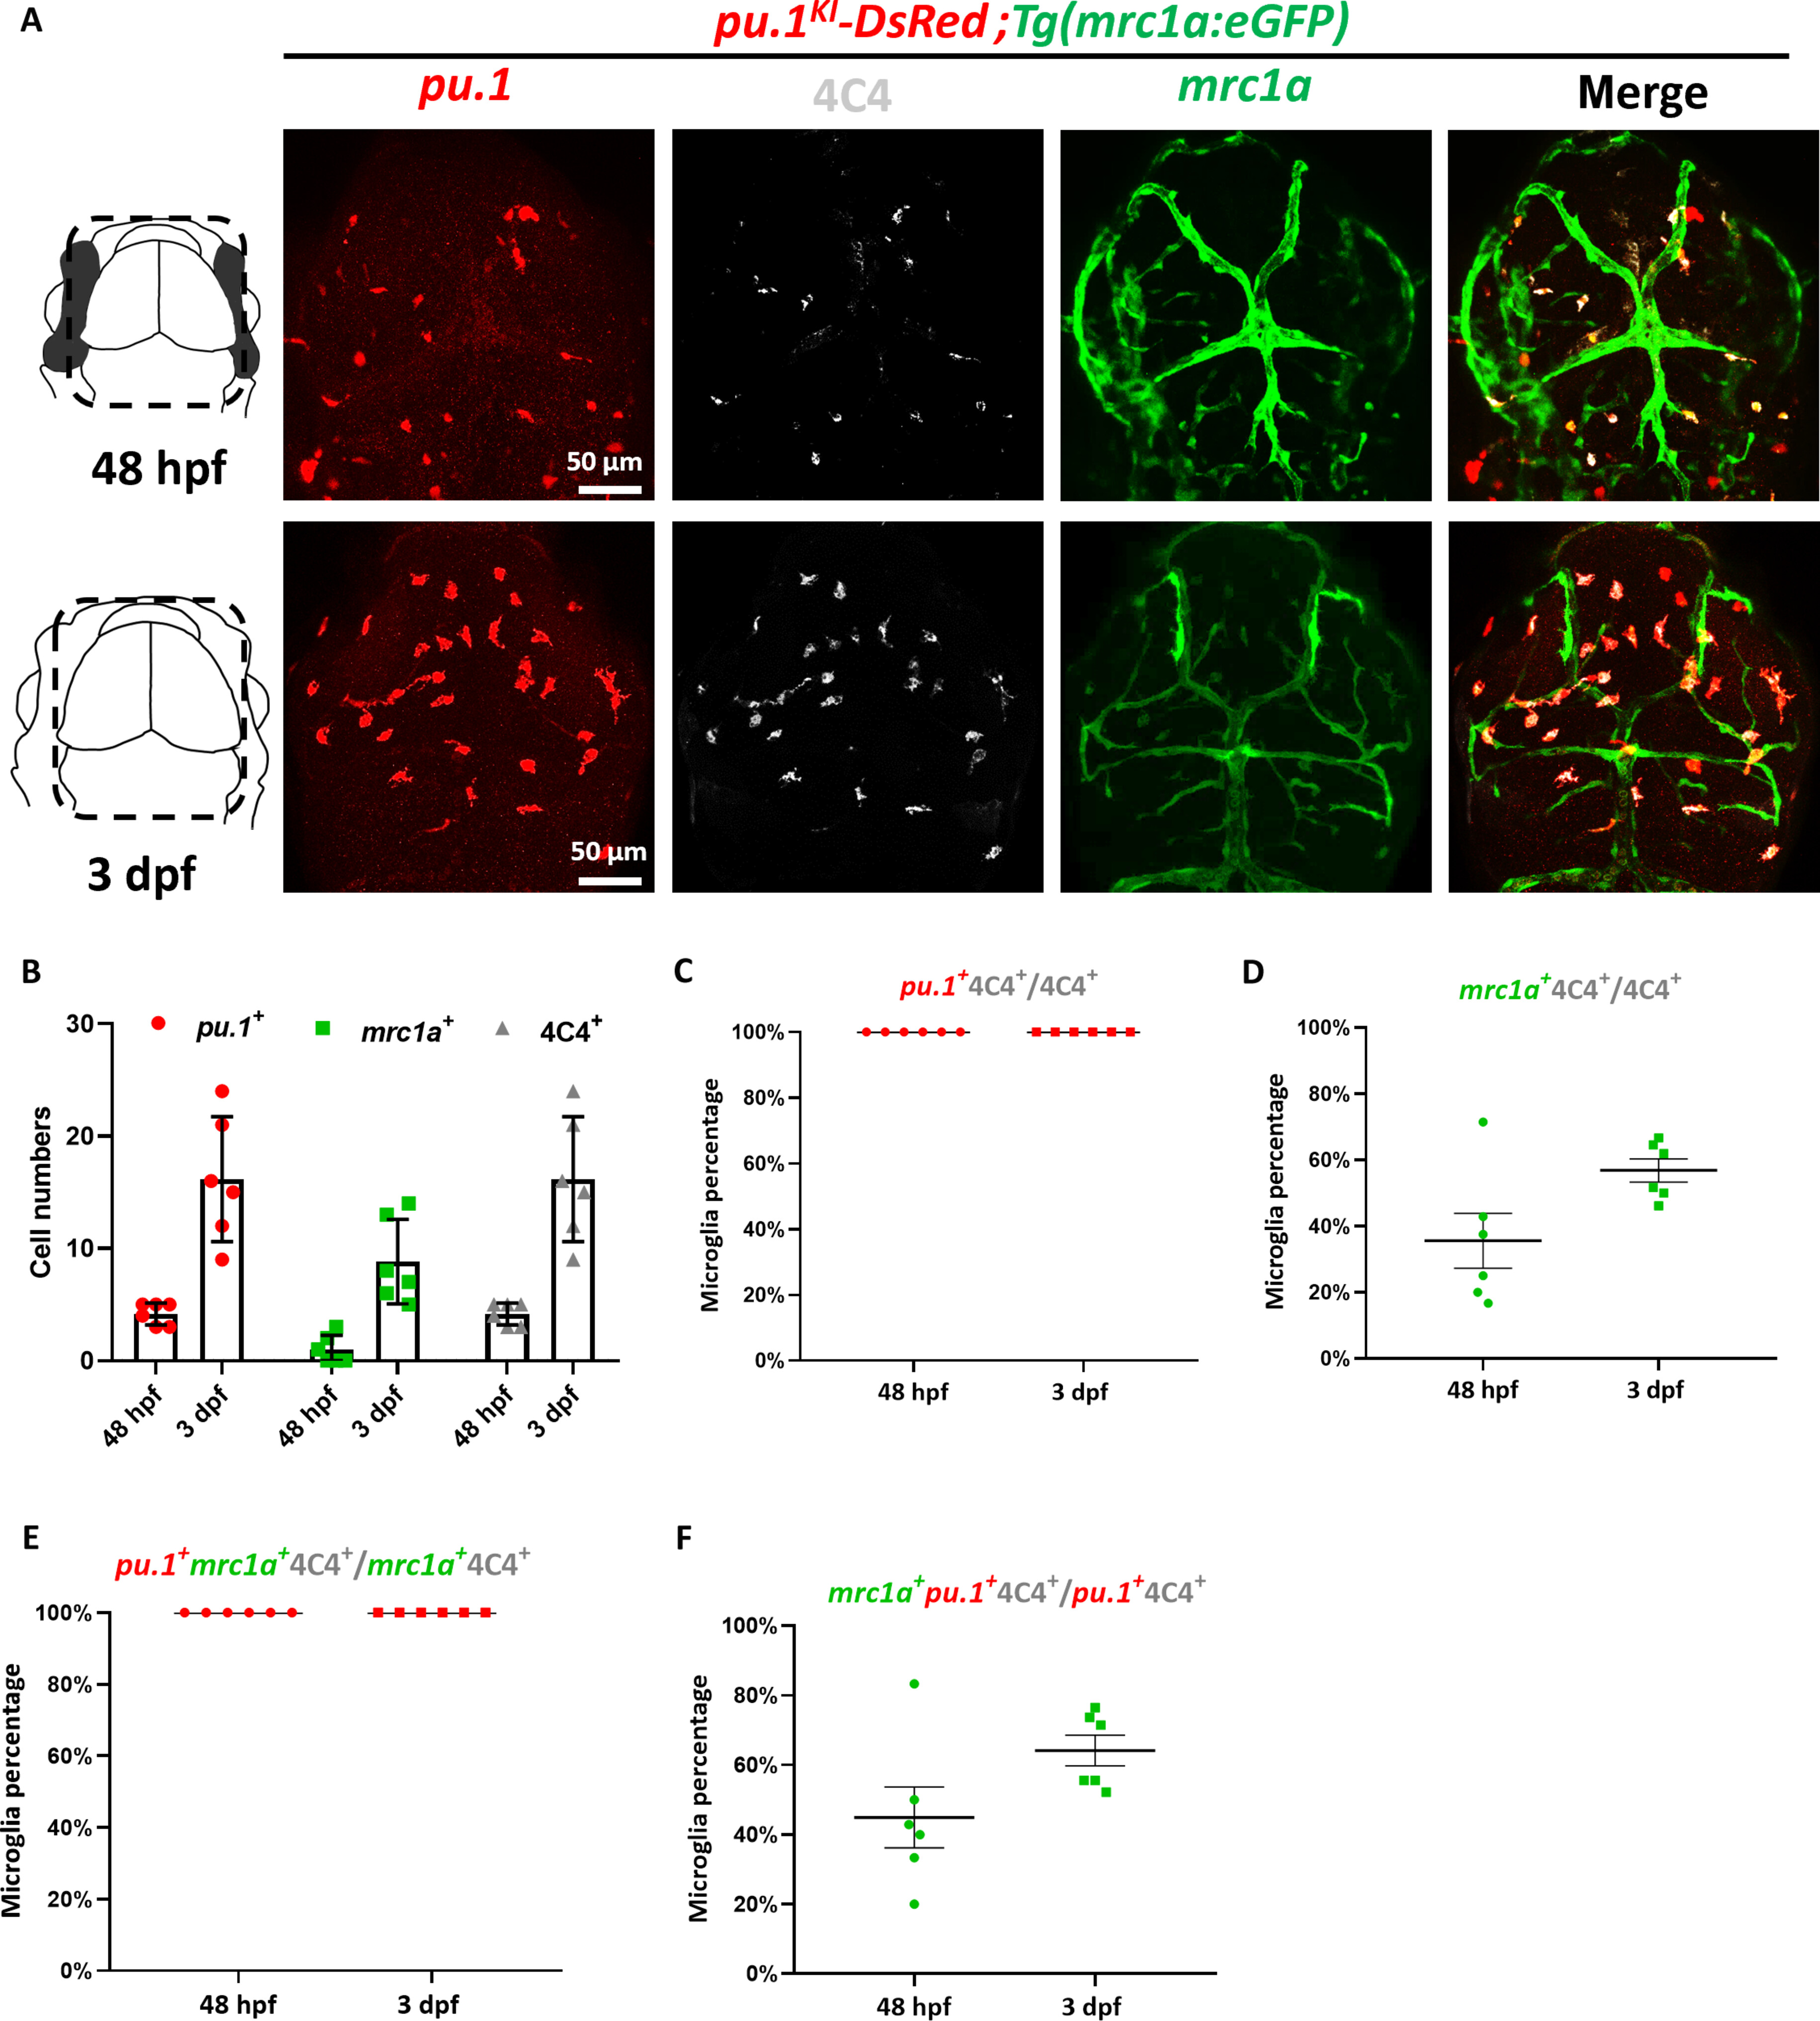
Fig. 2 Characterization of pu.1+mrc1a+ microglia at 48 hpf and 3 dpf. (A) Schematic diagram of imaging region and representative images of pu.1KI-DsRed; Tg (mrc1a: eGFP) embryos stained with DsRed, 4C4, and eGFP antibodies at 48 hpf and 3 dpf. (B) Quantification of pu.1+, 4C4+, and mrc1a+ cells in brain at 48 hpf (n = 6) and 3 dpf (n = 6), respectively. (C) Percentage of pu.1+4C4+ microglia in all 4C4+ microglia at 48 hpf (n = 6) and 3 dpf (n = 6). (D) Percentage of mrc1a+4C4+ microglia in all 4C4+ microglia at 48 hpf and 3 dpf. (E) Percentage of pu.1+mrc1a+4C4+ microglia in all mrc1a+4C4+ microglia at 48 hpf and 3 dpf. (F) Percentage of mrc1a+pu.1+4C4+ microglia in all pu.1+4C4+ microglia at 48 hpf and 3 dpf. Error bars represent � SEM.