FIGURE SUMMARY
Title

The miR-144/Hmgn2 regulatory axis orchestrates chromatin organization during erythropoiesis

Authors
Kretov, D.A., Folkes, L., Mora-Martin, A., Walawalkar, I.A., Imrat, ., Syedah, N., Vanuytsel, K., Moxon, S., Murphy, G.J., Cifuentes, D.
Source
Full text @ Nat. Commun.

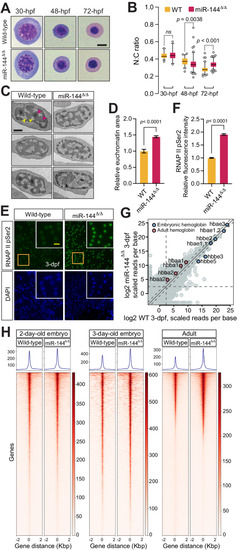
Loss of miR-144 impairs chromatin condensation during erythropoiesis.

A May–Grünwald–Giemsa staining of peripheral blood cells isolated from miR-144Δ/Δ and wild-type siblings at 30-hpf, 48-hpf, and 72-hpf. Scale bar indicates 5 µm in length. B Quantitative analysis of nucleus-to-cytoplasm area ratio of erythrocytes stained in (A). Individual cells from the pooled blood of ~100 embryos, which in turn are the mixed offspring of multiple breeding pairs are analyzed in each case (wild-type: n = 32, n = 51, and n = 81 cells; miR-144Δ/Δ: n = 26, n = 113, and n = 108 cells, respectively at 30, 48, and 72-hpf). P values from one-way ANOVA test. Boxes enclose data between the 25th and 75th percentile, with horizontal bar indicating the median. Whiskers enclose 5th to 95th percentiles. C Transmission Electron Microscopy of erythrocytes isolated from 3-dpf embryos (yellow arrows indicate euchromatin and magenta indicate heterochromatin). Scale bar indicates 1 µm in length. D Quantification of euchromatic regions of the nuclei from (C). n = 31 cells from wild-type and n = 29 cells from miR-144Δ/Δ mutant cells derived from a pool of bled embryos are analyzed in each case. P value from two-tailed unpaired t test equals P < 0.0001. Error bars represent standard error of the mean. E Immunofluorescent staining of erythrocytes isolated from 3-dpf embryos with anti-RNAP II Ser2 antibodies. Scale bar indicates 10 µm in length. Data representative of three independent experiments. F Quantification of the nuclear signal of RNAP II Ser2 from (E). n = 100 cells are analyzed from each genotype. P values from two-tailed unpaired t test equals P < 0.0001. Error bars represent standard error of the mean. H Heatmaps of ATAC-seq analysis of erythrocytes isolated from peripheral blood 2-dpf, 3-dpf, and adult miR-144Δ/Δ fish and wild-type siblings. 2-dpf and adult samples are analyzed in triplicates, and 3-dpf samples in duplicates. G RNA Sequencing of erythrocytes isolated from 3-dpf. Average of two biological replicates is plotted. Expression of adult and embryonic globins is shown.

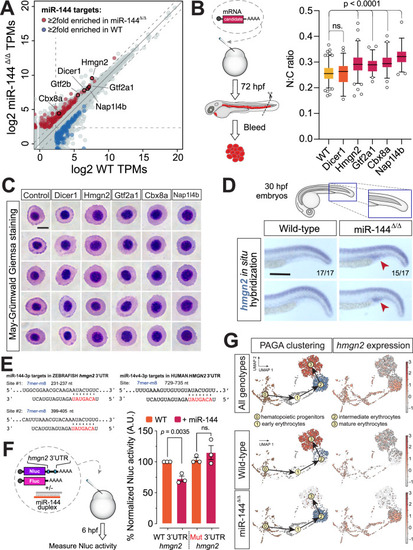
Hmgn2 is a miR-144 target whose expression is downregulated in mature erythrocytes.

A Quant-Seq data showing the transcriptomic profile of polyA-containing mRNAs in peripheral blood isolated from 2-dpf zebrafish embryos. Expression units are gene tags per million (TPMs). The average of three biological replicates is plotted. Upregulated (red) and downregulated (blue) miR-144 targets are shown. Genes involved in chromatin organization and transcription are labeled. B Experimental design of testing of candidate genes identified in (A) and quantification of the N:C ratio after May–Grünwald–Giemsa staining (C). Individual cells (n = 142 cells from wild-type, n = 57 from Dicer1, n = 113 from Hmgn2, n = 51 from Gtf2a1, n = 52 from Cbx8a, and n = 50 from Nap1l4b-injected embryos) derived from a pool of bled embryos at 72-hpf are analyzed. Wild-type and Hmgn2-injected data is derived from two independent pools of bled embryos. P values from the one-way ANOVA test with Dunnett’s multiple comparisons test. Boxes enclose data between the 25th and 75th percentile, with a horizontal bar indicating the median. Whiskers enclose 5th to 95th percentiles. Cartoon is adapted with permission from ref. 17. C May–Grünwald–Giemsa staining of peripheral blood cells isolated from wild-type 3-dpf embryos overexpressing different factors. Scale bar indicates 5 µm in length. D Whole-mount in situ hybridization of Hmgn2 mRNA at 30-hpf of miR-144Δ/Δ fish and wild-type siblings. Blue staining indicates the presence of hmgn2 mRNA. Red arrowhead points to the area where hmgn2 mRNA accumulates. Scale bar indicates 200 µm in length. E Predicted miR-144-3p-v1 target sites in hmgn2 3’UTR of Danio rerio and Homo sapiens. miR-144 seed region is indicated in red. F Nanoluciferase reporter assays to validate miR-144 targeting hmgn2 3’UTR. Data represent mean ± standard error of the mean of three technical replicates. P values from two-tailed unpaired t test. Cartoon is adapted with permission from ref. 17. G UMAP plots illustrating the single-cell sequencing results of adult zebrafish pronephros of miR-144Δ/Δ and wild-type zebrafish. Black arrows indicate the path of developmental trajectories inferred with scVelo/PAGA. Only erythroid branch is shown. The plots are colored according to cluster identity (PAGA clustering column) or hmgn2 expression. The expression of hmgn2 is shown as heat map where the color scale represents the natural log of normalized read counts +1 per cell, or ln(cpm+1).

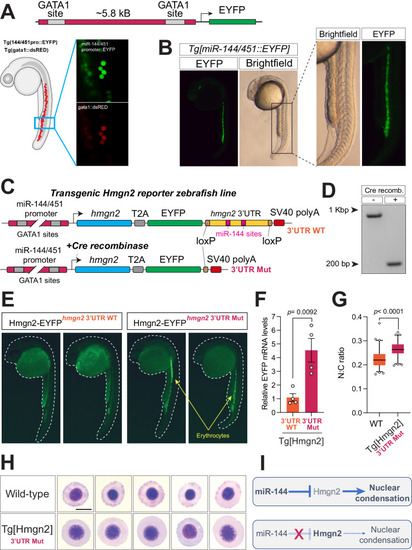
Disruption of miR-144-mediated repression of Hmgn2 impairs erythropoiesis.

A A schematic representation of a transgene expressing EYFP from miR-144/451 promoter and its validation by colocalization with dsRed that is expressed from gata1 promoter in double transgenic fish. Photos are taken at 24-hpf. B miR-144/451 promoter drives the expression of EYFP in the posterior blood island and caudal vein. C A schematic representation describing a strategy of generating a transgenic line to analyze the expression of Hmgn2 in zebrafish. D PCR validation of efficient 3’UTR deletion by Cre-mediated recombination. Data representative of two independent recombination experiments. E EYFP expression in 30-hpf old embryos with (right) and without (left) Cre mRNA injection. Data representative of two independent recombination experiments. F Real-time quantitative PCR of Hmgn2-EYFP transgene in control and injected with Cre mRNA embryos at 24-hpf. Expression is normalized to GAPDH mRNA levels. Data represent mean ± standard error of the mean of four biological replicates. P value from two-tailed unpaired t test equals P = 0.00092. G Quantitative analysis of the N:C ratio of erythrocytes stained in (H). Individual cells (n = 68 cells from wild-type and n = 62 cells from TgHmgn2) derived from a pool of bled embryos are analyzed in each case. P value from two-tailed unpaired t test equals P < 0.0001. Boxes enclose data between the 25th and 75th percentile, with horizontal bar indicating the median. Whiskers enclose 5th to 95th percentiles. H May–Grünwald–Giemsa staining of peripheral blood cells isolated from the transgenic embryos with mutant hmgn2 3’UTR and wild-type embryos at 3-dpf. Scale bar indicates 5 µm in length. I A schematic describing miR-144/Hmgn2 regulatory axis. In wild-type embryos, the expression of miR-144 actively represses Hmgn2 expression. This reduction on Hmng2 levels allows nuclear condensation to proceed normally. On the other hand, expression of Hmgn2 in the miR-144 mutant increases, which prevents normal nuclear condensation.

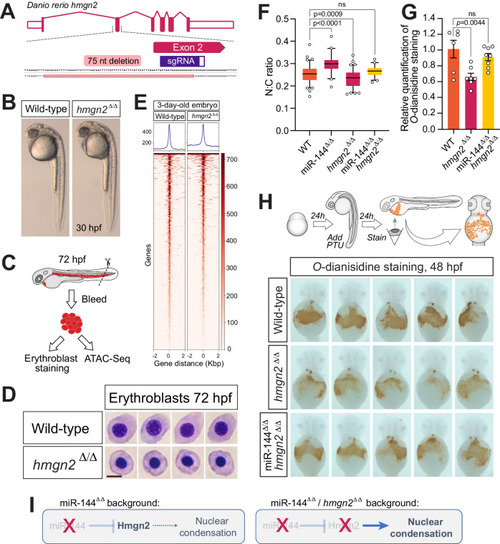
Reduction of Hmgn2 activity rescues the loss of miR-144 in erythropoiesis.

A Schematic representation of hmgn2 gene from Danio rerio and CRISPR/Cas9 induced deletion. B Maternal-zygotic Hmgn2 (hmgn2Δ/Δ) mutants at 30-hpf. C Cartoon describing the collection of peripheral blood from embryos at 72-hpf for ATAC-Seq and cellular analysis. Cartoon is adapted with permission from ref. 17. D May–Grünwald–Giemsa staining of peripheral blood cells isolated from hmgn2Δ/Δ and wild-type siblings at 72-hpf. Scale bar indicates 5 µm in length. Data representative of two independent bleeding and staining experiments. E Heatmaps display variations in chromatin accessibility, determined through ATAC-Seq analysis of three separate samples obtained from erythrocytes isolated from peripheral blood at 72 h post-fertilization (hpf) in both hmgn2Δ/Δ and wild-type sibling embryos. F Quantitative analysis of the nucleocytoplasmic ratio of erythrocytes isolated from miR-144Δ/Δ, miR-144Δ/Δ/hmgn2Δ/Δ and wild-type siblings stained with May–Grünwald–Giemsa to rescue miR-144Δ/Δ phenotype. Individual cells (n = 89 cells from wild-type, n = 41 from miR-144Δ/Δ, n = 85 from hmgn2Δ/Δ, and n = 45 from 144Δ/Δ/hmgn2Δ/Δ) from pools of bled embryos are analyzed in each case. Wild-type and hmgn2Δ/Δ data are derived from two independent pools of bled embryos. P values from one-way ANOVA with Dunnett’s multiple comparisons test. Boxes enclose data between the 25th and 75th percentile, with a horizontal bar indicating the median. Whiskers enclose 5th to 95th percentiles. G Relative quantification of the area stained with O-dianisidine in the embryos shown in (H). Data represent mean ± standard error of the mean. P values from one-way ANOVA with Dunnett’s multiple comparisons test. HO-dianisidine staining of 2-dpf embryos to reveal hemoglobinized cells. Embryos are pre-treated with PTU to induce mild oxidative stress to exacerbate any defect in erythropoiesis. n = 6 of wild-type, n = 7 of hmgn2Δ/Δ, and n = 8 of miR-144Δ/Δ/hmgn2Δ/Δ individual embryos are analyzed. I Schematic of genetic probing of miR-144/hmgn2 regulatory axis. In miR-144 mutant embryos, the absence of miR-144-mediated repression drives Hmgn2 overexpression, which in turn leads to reduced chromatin compaction. In the double miR-144Δ/Δ/hmgn2Δ/Δ embryos, the absence of Hmgn2 activity rescues the effect of the loss of miR-144 in nuclear condensation.

Probing the HMGN2/miR-144 regulatory axis in human erythroid progenitor cells.

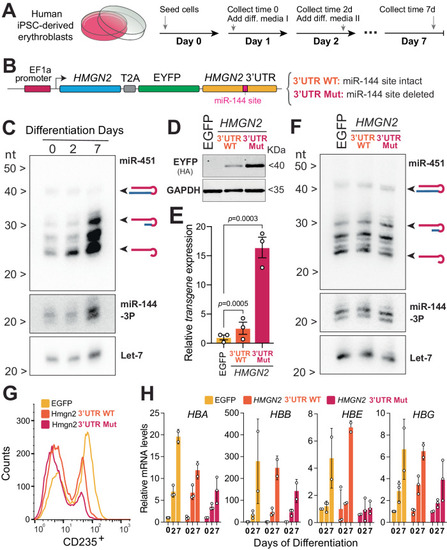
A Experimental protocol to further induce the differentiation of human iPSC-derived erythroblast cells. Cartoon is adapted with permission from ref. 17. B A schematic representation describing a strategy of generating cell lines to analyze the expression of Hmgn2 in human iPSC-derived erythroblast cells. C Northern blot analysis to detect miR-451, miR-144, and let-7 during the time course of cell differentiation. Blot representative of three biological replicates. To see the relative position of miR-144 and let-7 to the molecular weight markers please refer to the uncropped gel in Source Data file. D Western blot to detect accumulation of EYFP which is expressed from the transgenic construct either with wild-type 3’UTR or with mutant miR-144 target site at the time point 0. Blot representative of three biological replicates. E Real-time quantitative PCR of Hmgn2-EYFP transgene in at the time point 0. Expression is normalized on GAPDH mRNA. Data represent mean ± standard error of the mean of three biological replicates. P values from one-way ANOVA. F Northern blot analysis to validate that overexpression of transgenic construct does not affect miR-451 and miR-144 levels at the time point 0. Blot representative of three biological replicates. To see the relative position of miR-144 and let-7 to the molecular weight markers please refer to the uncropped gel in Source Data file. G Flow cytometry analysis (FACS) of erythroid cells at the 7-day of differentiation to quantify the expression levels of CD235. H Real-time quantitative PCR of globin A (HBA), globin B (HBB), globin E (HBE), globin E (HBG) at indicated collection time points. Expression is normalized on GAPDH mRNA. Data derived from n = 2 or n = 3 biological replicates. Bars represent mean ± standard error of the mean. We fitted the data to a mixed model with a Geisser–Greenhouse correction, to reject the null hypothesis that all genotypes have the same population means of globin expression for HBA (P < 0.0001), HBG (P = 0.0417), and HBE (P = 0.0015), but not HBB (P = 0.3536).

Acknowledgments
This image is the copyrighted work of the attributed author or publisher, and ZFIN has permission only to display this image to its users. Additional permissions should be obtained from the applicable author or publisher of the image. Full text @ Nat. Commun.