|
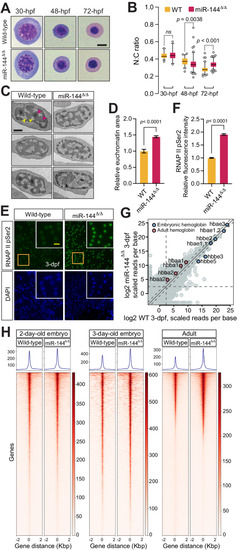
Loss of miR-144 impairs chromatin condensation during erythropoiesis. A May–Grünwald–Giemsa staining of peripheral blood cells isolated from miR-144Δ/Δ and wild-type siblings at 30-hpf, 48-hpf, and 72-hpf. Scale bar indicates 5 µm in length. B Quantitative analysis of nucleus-to-cytoplasm area ratio of erythrocytes stained in (A). Individual cells from the pooled blood of ~100 embryos, which in turn are the mixed offspring of multiple breeding pairs are analyzed in each case (wild-type: n = 32, n = 51, and n = 81 cells; miR-144Δ/Δ: n = 26, n = 113, and n = 108 cells, respectively at 30, 48, and 72-hpf). P values from one-way ANOVA test. Boxes enclose data between the 25th and 75th percentile, with horizontal bar indicating the median. Whiskers enclose 5th to 95th percentiles. C Transmission Electron Microscopy of erythrocytes isolated from 3-dpf embryos (yellow arrows indicate euchromatin and magenta indicate heterochromatin). Scale bar indicates 1 µm in length. D Quantification of euchromatic regions of the nuclei from (C). n = 31 cells from wild-type and n = 29 cells from miR-144Δ/Δ mutant cells derived from a pool of bled embryos are analyzed in each case. P value from two-tailed unpaired t test equals P < 0.0001. Error bars represent standard error of the mean. E Immunofluorescent staining of erythrocytes isolated from 3-dpf embryos with anti-RNAP II Ser2 antibodies. Scale bar indicates 10 µm in length. Data representative of three independent experiments. F Quantification of the nuclear signal of RNAP II Ser2 from (E). n = 100 cells are analyzed from each genotype. P values from two-tailed unpaired t test equals P < 0.0001. Error bars represent standard error of the mean. H Heatmaps of ATAC-seq analysis of erythrocytes isolated from peripheral blood 2-dpf, 3-dpf, and adult miR-144Δ/Δ fish and wild-type siblings. 2-dpf and adult samples are analyzed in triplicates, and 3-dpf samples in duplicates. G RNA Sequencing of erythrocytes isolated from 3-dpf. Average of two biological replicates is plotted. Expression of adult and embryonic globins is shown.
|