|
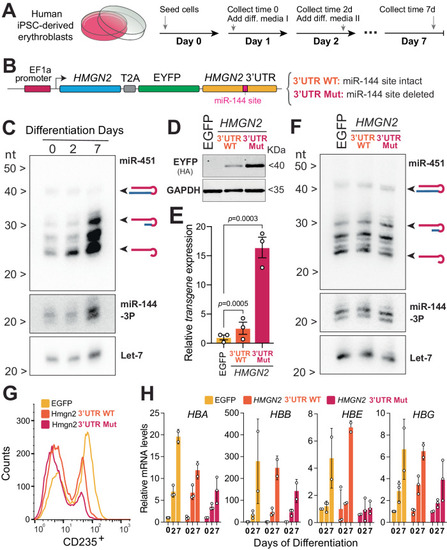
Probing the HMGN2/miR-144 regulatory axis in human erythroid progenitor cells. A Experimental protocol to further induce the differentiation of human iPSC-derived erythroblast cells. Cartoon is adapted with permission from ref. 17. B A schematic representation describing a strategy of generating cell lines to analyze the expression of Hmgn2 in human iPSC-derived erythroblast cells. C Northern blot analysis to detect miR-451, miR-144, and let-7 during the time course of cell differentiation. Blot representative of three biological replicates. To see the relative position of miR-144 and let-7 to the molecular weight markers please refer to the uncropped gel in Source Data file. D Western blot to detect accumulation of EYFP which is expressed from the transgenic construct either with wild-type 3’UTR or with mutant miR-144 target site at the time point 0. Blot representative of three biological replicates. E Real-time quantitative PCR of Hmgn2-EYFP transgene in at the time point 0. Expression is normalized on GAPDH mRNA. Data represent mean ± standard error of the mean of three biological replicates. P values from one-way ANOVA. F Northern blot analysis to validate that overexpression of transgenic construct does not affect miR-451 and miR-144 levels at the time point 0. Blot representative of three biological replicates. To see the relative position of miR-144 and let-7 to the molecular weight markers please refer to the uncropped gel in Source Data file. G Flow cytometry analysis (FACS) of erythroid cells at the 7-day of differentiation to quantify the expression levels of CD235. H Real-time quantitative PCR of globin A (HBA), globin B (HBB), globin E (HBE), globin E (HBG) at indicated collection time points. Expression is normalized on GAPDH mRNA. Data derived from n = 2 or n = 3 biological replicates. Bars represent mean ± standard error of the mean. We fitted the data to a mixed model with a Geisser–Greenhouse correction, to reject the null hypothesis that all genotypes have the same population means of globin expression for HBA (P < 0.0001), HBG (P = 0.0417), and HBE (P = 0.0015), but not HBB (P = 0.3536).
|