|
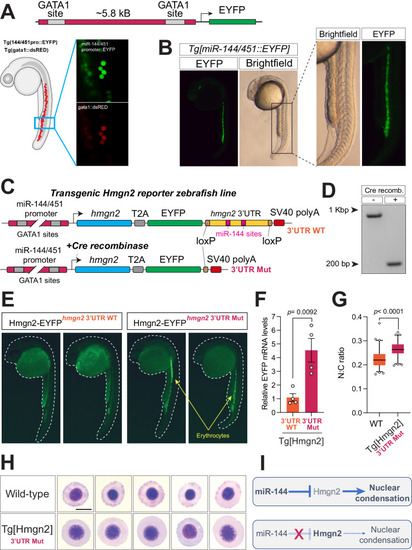
Disruption of miR-144-mediated repression of Hmgn2 impairs erythropoiesis. A A schematic representation of a transgene expressing EYFP from miR-144/451 promoter and its validation by colocalization with dsRed that is expressed from gata1 promoter in double transgenic fish. Photos are taken at 24-hpf. B miR-144/451 promoter drives the expression of EYFP in the posterior blood island and caudal vein. C A schematic representation describing a strategy of generating a transgenic line to analyze the expression of Hmgn2 in zebrafish. D PCR validation of efficient 3’UTR deletion by Cre-mediated recombination. Data representative of two independent recombination experiments. E EYFP expression in 30-hpf old embryos with (right) and without (left) Cre mRNA injection. Data representative of two independent recombination experiments. F Real-time quantitative PCR of Hmgn2-EYFP transgene in control and injected with Cre mRNA embryos at 24-hpf. Expression is normalized to GAPDH mRNA levels. Data represent mean ± standard error of the mean of four biological replicates. P value from two-tailed unpaired t test equals P = 0.00092. G Quantitative analysis of the N:C ratio of erythrocytes stained in (H). Individual cells (n = 68 cells from wild-type and n = 62 cells from TgHmgn2) derived from a pool of bled embryos are analyzed in each case. P value from two-tailed unpaired t test equals P < 0.0001. Boxes enclose data between the 25th and 75th percentile, with horizontal bar indicating the median. Whiskers enclose 5th to 95th percentiles. H May–Grünwald–Giemsa staining of peripheral blood cells isolated from the transgenic embryos with mutant hmgn2 3’UTR and wild-type embryos at 3-dpf. Scale bar indicates 5 µm in length. I A schematic describing miR-144/Hmgn2 regulatory axis. In wild-type embryos, the expression of miR-144 actively represses Hmgn2 expression. This reduction on Hmng2 levels allows nuclear condensation to proceed normally. On the other hand, expression of Hmgn2 in the miR-144 mutant increases, which prevents normal nuclear condensation.
|

