IMAGE

Fig. 2

ID
ZDB-IMAGE-240509-49
Source
Figures for Kretov et al., 2024
Image
Figure Caption

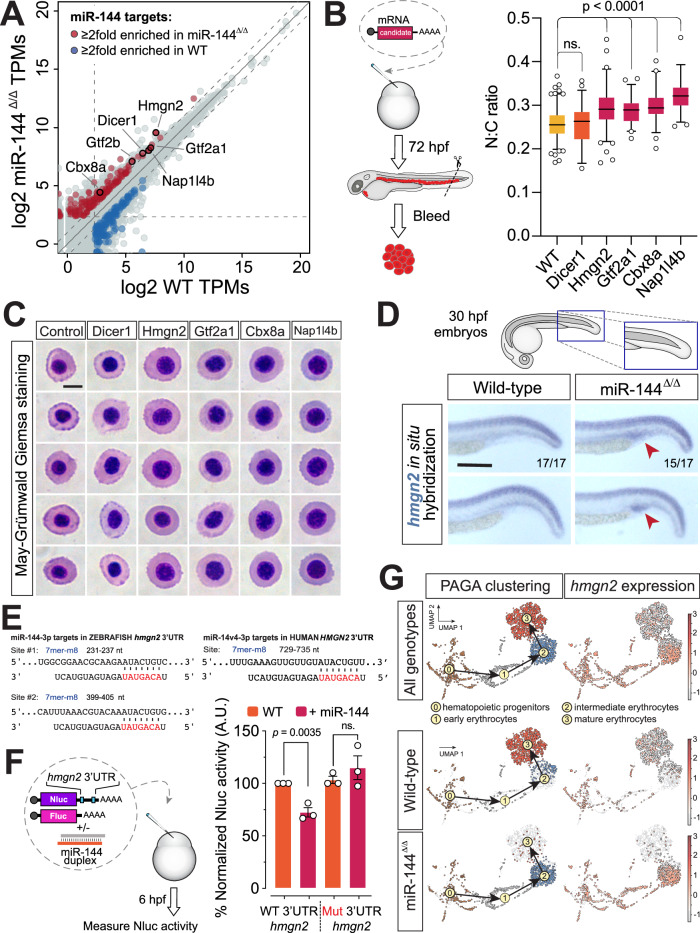
Fig. 2 Hmgn2 is a miR-144 target whose expression is downregulated in mature erythrocytes.

A Quant-Seq data showing the transcriptomic profile of polyA-containing mRNAs in peripheral blood isolated from 2-dpf zebrafish embryos. Expression units are gene tags per million (TPMs). The average of three biological replicates is plotted. Upregulated (red) and downregulated (blue) miR-144 targets are shown. Genes involved in chromatin organization and transcription are labeled. B Experimental design of testing of candidate genes identified in (A) and quantification of the N:C ratio after May–Grünwald–Giemsa staining (C). Individual cells (n = 142 cells from wild-type, n = 57 from Dicer1, n = 113 from Hmgn2, n = 51 from Gtf2a1, n = 52 from Cbx8a, and n = 50 from Nap1l4b-injected embryos) derived from a pool of bled embryos at 72-hpf are analyzed. Wild-type and Hmgn2-injected data is derived from two independent pools of bled embryos. P values from the one-way ANOVA test with Dunnett’s multiple comparisons test. Boxes enclose data between the 25th and 75th percentile, with a horizontal bar indicating the median. Whiskers enclose 5th to 95th percentiles. Cartoon is adapted with permission from ref. 17. C May–Grünwald–Giemsa staining of peripheral blood cells isolated from wild-type 3-dpf embryos overexpressing different factors. Scale bar indicates 5 µm in length. D Whole-mount in situ hybridization of Hmgn2 mRNA at 30-hpf of miR-144Δ/Δ fish and wild-type siblings. Blue staining indicates the presence of hmgn2 mRNA. Red arrowhead points to the area where hmgn2 mRNA accumulates. Scale bar indicates 200 µm in length. E Predicted miR-144-3p-v1 target sites in hmgn2 3’UTR of Danio rerio and Homo sapiens. miR-144 seed region is indicated in red. F Nanoluciferase reporter assays to validate miR-144 targeting hmgn2 3’UTR. Data represent mean ± standard error of the mean of three technical replicates. P values from two-tailed unpaired t test. Cartoon is adapted with permission from ref. 17. G UMAP plots illustrating the single-cell sequencing results of adult zebrafish pronephros of miR-144Δ/Δ and wild-type zebrafish. Black arrows indicate the path of developmental trajectories inferred with scVelo/PAGA. Only erythroid branch is shown. The plots are colored according to cluster identity (PAGA clustering column) or hmgn2 expression. The expression of hmgn2 is shown as heat map where the color scale represents the natural log of normalized read counts +1 per cell, or ln(cpm+1).

Acknowledgments
This image is the copyrighted work of the attributed author or publisher, and ZFIN has permission only to display this image to its users. Additional permissions should be obtained from the applicable author or publisher of the image. Full text @ Nat. Commun.