FIGURE SUMMARY
Title

Lactylation-driven FTO targets CDK2 to aggravate microvascular anomalies in diabetic retinopathy

Authors
Chen, X., Wang, Y., Wang, J.N., Zhang, Y.C., Zhang, Y.R., Sun, R.X., Qin, B., Dai, Y.X., Zhu, H.J., Zhao, J.X., Zhang, W.W., Ji, J.D., Yuan, S.T., Shen, Q.D., Liu, Q.H.
Source
Full text @ EMBO Mol. Med.

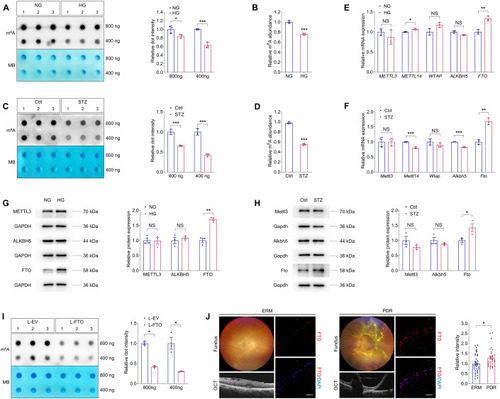
Identification of FTO as a potential regulator of DR

(A) m6A dot blot assay of global m6A abundance in HUVECs treated with normal glucose (5 mM, NG) or high glucose (25 mM, HG) using 800 or 400 ng total RNAs. MB staining is used as a loading control. n = 3 per group. (B) m6A RNA methylation quantification assay of global m6A abundance in HUVECs treated with NG or HG. n = 3 per group. (C) m6A dot blot assay of global m6A abundance in retina originated from control or STZ mice using 800 or 400 ng total RNAs. MB staining is applied as a loading control. n = 3 per group. (D) m6A RNA methylation quantification assay of global m6A abundance in retina originated from control or STZ mice. n = 3 per group. (E) qPCR shows mRNA levels of m6A regulators METTL3, METTL14, WTAP, ALKBH5 and FTO in HUVECs treated with NG or HG. n = 3 per group. (F) qPCR presents mRNA levels of m6A regulators Mettl3, Mettl14, Wtap, Alkbh5 and Fto in retina originated from control or STZ mice. n = 3 per group. (G) Immunoblotting of METTL3, ALKBH5 and FTO in HUVECs treated with NG or HG. GAPDH is used as an internal control. n = 3 per group. (H) Immunoblotting of Mettl3, Alkbh5 and Fto in retina originated from control or STZ mice. GAPDH is used as an internal control. n = 3 per group. (I) m6A dot blot assay of global m6A abundance in HUVECs transduced with L-EV or L-FTO using 800 or 400 ng total RNAs. MB staining is applied as a loading control. n = 3 per group. (J) Immunofluorescence staining of FTO in FVMs obtained from PDR patients or ERMs isolated from age matched controls without diabetes. Fundus photographs and OCT images of PDR patients or age matched controls with ERM are shown. n = 35, ERM; n = 33, PDR. Scale bar: 50 µm. Data information: Data represent different numbers (n) of biological replicates. Data are shown as mean ± SEM. Two-tailed Student’s t test is used. NS: not significant (p > 0.05); *p < 0.05; **p < 0.01; and ***p < 0.001. Source data are available online for this figure.

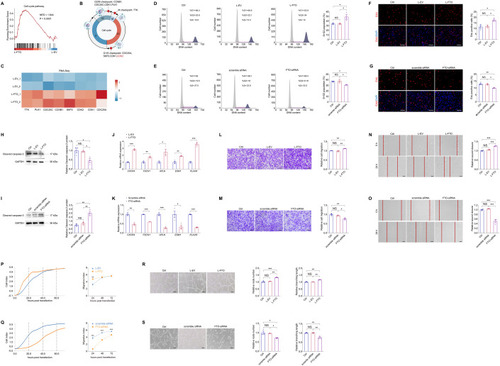
FTO promotes endothelial cell cycle progression and tip cell formation to facilitate angiogenesis in vitro.

(A) GSEA plot of pathways enriched in HUVECs transduced with L-FTO is presented. (B, C) Diagram (B) and heatmap (C) show differential expression of genes involved in cell cycle checkpoints in HUVECs transduced with L-EV or L-FTO. (D, E) Flow cytometric analyses on untreated HUVECs, HUVECs transduced with L-EV/L-FTO (D), or transfected with scramble siRNA/FTO-siRNA (E). n = 3 per group. (F, G) EdU assay on untreated HUVECs, HUVECs transduced with indicated lentivirus (F) or transfected with distinct siRNAs (G). Cell nuclei are counterstained with DAPI. n = 3 per group. Scale bar: 60 µm. (H, I) Immunoblotting of cleaved caspase-3 in untreated HUVECs, HUVECs transduced with L-EV/L-FTO (H), or scramble siRNA/FTO-siRNA (I). GAPDH is used as an internal control. n = 3 per group. (J, K). mRNA levels of tip cell markers (CXCR4, FSCN1, APLN, ESM1 and PLAUR) detected by qPCR in HUVECs transduced with indicated lentivirus (J) or transfected with distinct siRNAs (K). n = 3 per group. (L, M) Transwell migration assay on untreated HUVECs or HUVECs transduced with indicated lentivirus (L) or transfected with distinct siRNAs (M). n = 3 per group. Scale bar: 50 µm. (N, O) Scratch test on untreated HUVECs or HUVECs transduced with indicated lentivirus (N) or transfected with distinct siRNAs (O). n = 3 per group. Scale bar: 100 µm. (P, Q) RTCA system demonstrates migration rates of HUVECs transduced with L-EV/L-FTO (P), or transfected with scramble siRNA/FTO-siRNA (Q). n = 3 per group. (R, S) Tube formation assay on untreated HUVECs or HUVECs transduced with L-EV/L-FTO (R), or transfected with scramble siRNA/FTO-siRNA (S). n = 3 per group. Scale bar: 100 µm. Data information: Data represent different numbers (n) of biological replicates. Data are shown as mean ± SEM. One-way ANOVA followed by Bonferroni’s test is used in (DI, L–O, R, S). Two-tailed Student’s t test is used in (J, K, P, Q). NS: not significant (p > 0.05); *p < 0.05; **p < 0.01; and ***p < 0.001. Source data are available online for this figure.

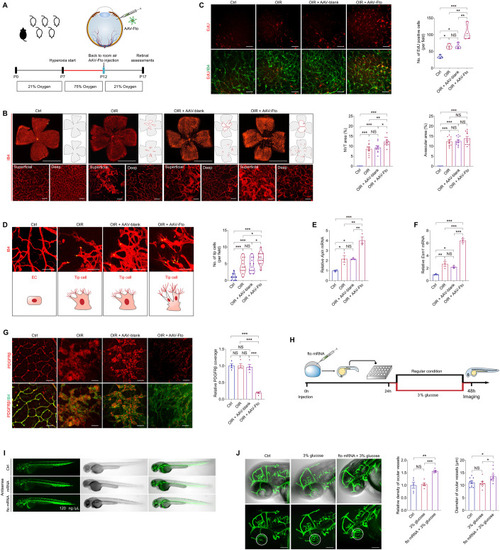
FTO promotes endothelial tip cell formation to facilitate neovascularization in mice and zebrafish.

(A) Experimental scheme for (BG) (B) Fluorescent staining of IB4 in retinal flat mounts originated from control, OIR mice without other treatment, and OIR mice intra-vitreal injected with AAV-blank/AAV-Fto at P17. n = 11 per group. Magnificent images are shown below to better visualize superficial and deep vascular plexuses. Gray dotted lines indicate the edge of the retina. Red lines suggest the avascular area. NVTs are represented by red dots. Representative images along with quantification results of NVT and avascular areas are shown. Scale bar: 2000 µm (up); 50 µm (below). (C) Fluorescent staining of EdU and IB4 in retinal flat mounts of control, OIR mice without other treatment, and OIR mice intra-vitreal injected with AAV-blank/AAV-Fto at P17. n = 4 per group. (D) Fluorescent staining of IB4 in retinal flat mounts of control, OIR mice without other treatment, and OIR mice intra-vitreal injected with AAV-blank/AAV-Fto at P17. n = 12 per group. Tip cells are indicated by yellow asterisks. Representative images along with quantification results of tip cell number per field are shown. Scale bar: 50 µm. (E, F) mRNA expression of tip cell markers Apln (E) and Esm1 (F) detected by qPCR in neural retinas of control, OIR mice without other treatment, and OIR mice intra-vitreal injected with AAV-blank/AAV-Fto at P17. n = 3 per group. (G) Immunofluorescence staining of PDGFRβ and IB4 in retinal flat mounts of control, OIR mice without other treatment, and OIR mice intra-vitreal injected with distinct virus at P17. n = 4 per group. (H) Experimental scheme for (I, J). (I) Truncal vasculatures demonstrated by endogenous EGFP and morphological structures of control and zebrafish injected with antisense or fto mRNA. n = 3 per group. (J) Ocular vasculatures shown by endogenous EGFP and morphological structures of control and zebrafish receiving indicated treatments. Ocular vasculatures are indicated by white circles. Representative images along with quantification results of ocular vessel density (n = 5 per group) and diameters (n = 8–10 per group) are shown. Scale bar: 100 µm. Data information: Data represent different numbers (n) of biological replicates. Data are shown as mean ± SEM. One-way ANOVA followed by Bonferroni’s test is used. NS: not significant (p > 0.05); *p < 0.05; **p < 0.01; and ***p < 0.001. Source data are available online for this figure.

EXPRESSION / LABELING:
Gene:
Fish:
Anatomical Terms:
Stage: Long-pec

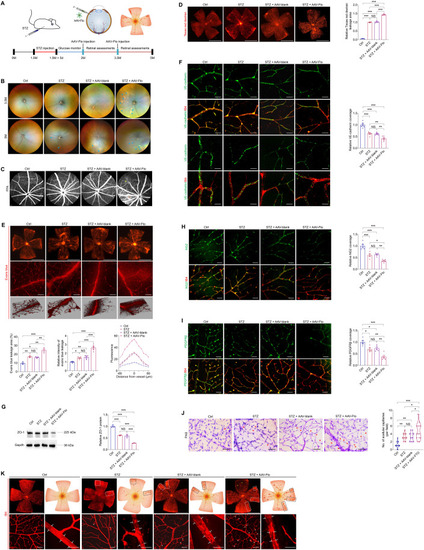
FTO regulates EC-pericyte crosstalk to trigger diabetes-induced microvascular dysfunction in mice.

(A) Experimental scheme for (BK). (B, C) Representative images of fundus photos (B) and FFA (C) of control, STZ mice without injection, and STZ mice intra-vitreal injected with AAV-blank/AAV-Fto at indicated time points after injection. n = 3 per group. Blue arrows represent cotton wool spot-like lesions. Red arrow indicates leakage spot. Yellow arrow suggests abnormal vascular perfusion. (D, E) Fluorescence of Texas red dextran (D) and Evans blue (E) are visualized in retinal flat mounts of control, STZ mice without injection, and STZ mice intra-vitreal injected with AAV-blank/AAV-Fto. n = 3 per group. Representative images along with quantification results of leakage area and leaky flourescence intensity are shown. Scale bar: 2000 µm ((D) and up in (E)); 50 µm (below in (E)). (F) Immunofluorescence staining of VE-cadherin and IB4 in retinal flat mounts of control, STZ mice without injection, and STZ mice intra-vitreal injected with AAV-blank/AAV-Fto. n = 6 per group. Scale bar: 50 µm (upper); 20 µm (below). (G) Immunoblotting of ZO-1 in neural retinas collected from control, STZ mice without injection, and STZ mice intra-vitreal injected with AAV-blank/AAV-Fto. Gapdh is used as internal control. n = 3 per group. (H) Immunofluorescence staining of NG2 and IB4 in retinal flat mounts of control, STZ mice without injection, and STZ mice intra-vitreal injected with AAV-blank/AAV-Fto. n = 5 per group. Yellow arrowheads indicate pericytes. Scale bar: 50 µm. (I) Immunofluorescence staining of PDGFRβ and IB4 in retinal flat mounts of control, STZ mice without injection, and STZ mice intra-vitreal injected with AAV-blank/AAV-Fto. n = 5 per group. Scale bar: 50 µm. (J) PAS staining of trypsin digested retinal vessels isolated from control, STZ mice without injection, and STZ mice intra-vitreal injected with AAV-blank/AAV-Fto. n = 14 per group. Scale bar: 50 µm. (K) Fluorescence staining of IB4 in retinal flat mounts of control, STZ mice without injection, and STZ mice intra-vitreal injected with AAV-blank/AAV-Fto. n = 3 per group. IRMAs are represented by white and black rectangles. Capillary dropout regions are suggested by yellow arrowheads. White brackets indicate structures of main vessels, and white asterisks represent activated microglia cells wrapping around retinal vessels. Scale bar: 2000 µm (up); 50 µm (below). Data information: Data represent different numbers (n) of biological replicates. Data are shown as mean ± SEM. One-way ANOVA followed by Bonferroni’s test is used. NS: not significant (p > 0.05); *p < 0.05; **p < 0.01; and ***p < 0.001. Source data are available online for this figure.

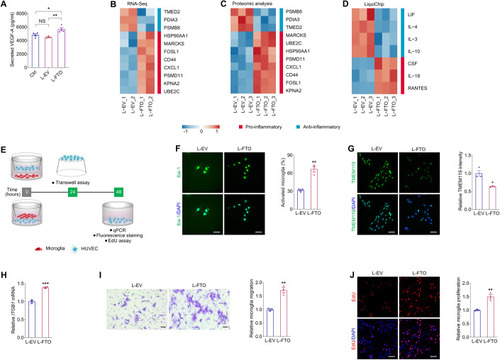
FTO triggers vascular inflammation and regulates EC-microglia crosstalk in vitro.

(A) VEGF-A secretion in HUVECs detected by ELISA in the control group and HUVECs transduced with L-EV or L-FTO. n = 4 per group. (B, C) Hierarchical clustering of pro- and anti-inflammatory genes detected by RNA-Seq (B) and proteins revealed by TMT-based quantitative proteomic analyses (C) in HUVECs transduced with L-EV or L-FTO. (D) Heatmap of pro- and anti-inflammatory cytokines in the culture medium of HUVECs transduced with L-EV or L-FTO as detected by LiquiChip. (E) Experimental scheme for (FJ). (F, G) Immunofluorescence staining of Iba-1 (F) and TMEM119 (G) in microglia co-cultured with HUVECs transduced with L-EV or L-FTO. Cell nuclei are counterstained with DAPI. n = 3 per group. Scale bar: 65 µm. (H). mRNA level of ITGB1 detected by qPCR in microglia co-cultured with HUVECs transduced with L-EV or L-FTO. n = 3 per group. (I). Transwell migration assay on microglia co-cultured with HUVECs transduced with L-EV or L-FTO. n = 3 per group. Scale bar: 50 µm. (J). EdU assay on microglia co-cultured with HUVECs transduced with L-EV or L-FTO. n = 3 per group. Scale bar: 60 µm. Data information: Data represent different numbers (n) of biological replicates. Data are shown as mean ± SEM. One-way ANOVA followed by Bonferroni’s test is used in (A). Two-tailed Student’s t test is used in (FJ). NS: not significant (p > 0.05); **p < 0.01; and ***p < 0.001. Source data are available online for this figure.

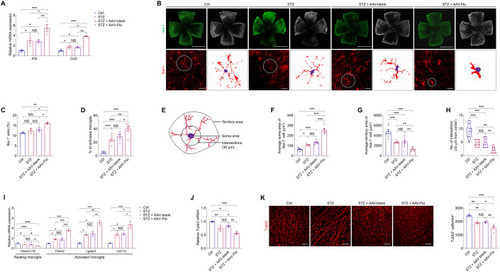
FTO triggers microglia activation and neurodegeneration in mice.

(A) qPCR shows mRNA levels of inflammatory factors Il1b and Ccl2 in neural retinas of control, STZ mice without injection, and STZ mice intra-vitreal injected with AAV-blank/AAV-Fto. n = 3-5 per group. (BD) Fluorescence staining of Iba-1 in retinal flat mounts of mice receiving indicated treatments is demonstrated. n = 3-6 per group. Representative images (B) along with quantification of Iba-1 positive microglia area (C) and activated microglia (D) are shown. Scale bar: 2000 µm (up); 50 µm (below). (E) The inset depicts the parameters regarding morphology of microglia. (FH) Quantification results of soma area (F), territory area (G) and intersection numbers at 30 µm from nuclei (H) in retinal microglia from mice receiving indicated treatments. n = 6-10 per group. (I, J) qPCR demonstrates mRNA levels of Tmem119, Trem2, Lgals3, Cd11c (I) and Tubb3 (J) in neural retinas of control, STZ mice without injection, and STZ mice intra-vitreal injected with AAV-blank/AAV-Fto. n = 3 per group. (K) Fluorescence staining of Tubb3 in retinal flat mounts of mice receiving indicated treatments is demonstrated. Tubb3+ cells, recognized by the round RGC bodies, were counted in three random areas within the radius of 0.5 to 1.5 mm from the optic disc, and averaged to estimate the RGC per mm2 in four retinal flat mounts per group. n = 4 per group. Scale bar: 50 µm. Data information: Data represent different numbers (n) of biological replicates. Data are shown as mean ± SEM. One-way ANOVA followed by Bonferroni’s test is used. NS: not significant (p > 0.05); *p < 0.05; **p < 0.01; and ***p < 0.001. Source data are available online for this figure.

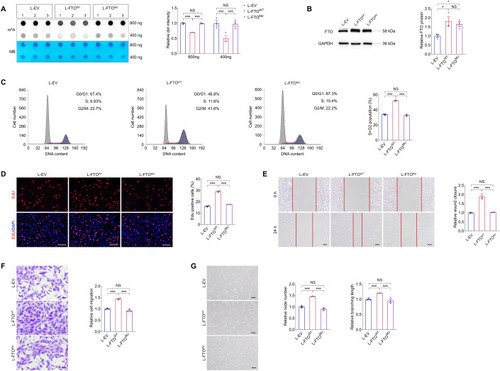
Demethylation activity is required for FTO to regulate EC features

(A) m6A dot blot assay of global m6A abundance in HUVECs transduced with L-EV, L-FTOWT or L-FTOMU using 800 or 400 ng total RNAs. MB staining is used as a loading control. n = 3 per group. (B) Immunoblotting of FTO in HUVECs transduced with L-EV, L-FTOWT or L-FTOMU. GAPDH is used as an internal control. n = 3 per group. (C) Flow cytometric analyses of cell cycle process in HUVECs transduced with L-EV, L-FTOWT or L-FTOMU. n = 3 per group. (D) EdU assay on HUVECs transduced with indicated lentivirus. n = 3 per group. Scale bar: 60 µm. (E) Scratch test on HUVECs transduced with L-EV, L-FTOWT or L-FTOMU. n = 3 per group. Scale bar: 100 µm. (F) Transwell migration assay on HUVECs transduced with indicated lentivirus. n = 3 per group. Scale bar: 50 µm. (G) Tube formation analyses on HUVECs transduced with L-EV, L-FTOWT or L-FTOMU. n = 3 per group. Scale bar: 100 µm. Data information: Data represent different numbers (n) of biological replicates. Data are shown as mean ± SEM. One-way ANOVA followed by Bonferroni’s test is used. NS: not significant (p > 0.05); *p < 0.05; and ***p < 0.001. Source data are available online for this figure.

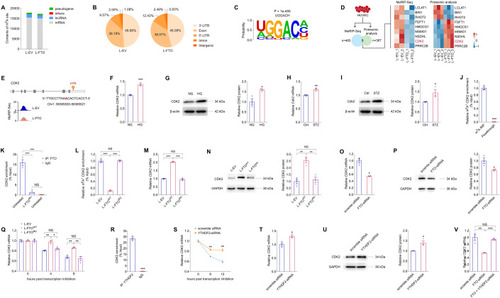
FTO regulates CDK2 mRNA stability with YTHDF2 as the reader in an m6A-dependent manner.

(A, B) MeRIP-Seq data of HUVECs transduced with L-EV or L-FTO. Contents of m6A site in all types of RNAs (A) and distribution of total m6A peaks in distinct regions of mRNA transcripts (B) are presented. (C). Sequence of enriched motif displayed by HOMER. (D) Genes containing m6A-hypo peaks with altered protein expression are sorted out. (E) Abundance of m6A peak in the CDK2 transcript in HUVECs transduced with L-EV or L-FTO detected by MeRIP-Seq. Genomic location of its containing m6A site is annotated. (F, G) mRNA (F) and protein (G) expression of CDK2 in HUVECs exposed to NG or HG. β-actin is used as an internal control. n = 3 per group. (H, I) Cdk2 mRNA and protein levels detected in neural retinas of control and STZ mice. β-actin is used as an internal control. n = 3 per group. (J) MeRIP-qPCR analysis of m6A enrichment on CDK2 mRNA in HUVECs. n = 3 per group. (K) FTO-RIP-qPCR validates the binding between FTO protein and CDK2 mRNA in untreated HUVECs but not in HUVECs transduced with L-FTOMU. n = 3 per group. (L). MeRIP-qPCR analysis of m6A enrichment on CDK2 mRNA in HUVECs transduced with L-EV, L-FTOWT or L-FTOMU. (M, N) mRNA (M) and protein (N) expression of CDK2 in HUVECs transduced with indicated lentivirus. GAPDH is used as an internal control. n = 3 per group. (O, P) CDK2 mRNA (O) and protein (P) levels in HUVECs transfected with scramble siRNA or FTO-siRNA. GAPDH was used as an internal control. n = 3 per group. (Q) CDK2 mRNA levels detected by qPCR in HUVECs transduced with indicated lentivirus at 0, 4 and 8 h post actinomycin D treatment. n = 3 per group. (R) YTHDF2-RIP-qPCR validation of YTHDF2 binding to CDK2 mRNA in HUVECs. n = 3 per group. (S) CDK2 mRNA levels detected by qPCR in HUVECs transfected with scramble siRNA or YTHDF2-siRNA at 0, 6 and 12 h post actinomycin D treatment. n = 3 per group. (T, U) CDK2 mRNA (T) and protein (U) levels in HUVECs transfected with scramble siRNA or YTHDF2-siRNA. GAPDH is used as an internal control. n = 3 per group. (V) CDK2 mRNA levels detected by qPCR in HUVECs transfected with scramble siRNA, FTO-siRNA, or FTO- and YTHDF2-siRNA. n = 3 per group. Data information: Data represent different numbers (n) of biological replicates. Data are shown as mean ± SEM. Two-tailed Student’s t test is used in (FJ, OP, RU). One-way ANOVA followed by Bonferroni’s test is used in (KN, Q, V). NS: not significant (p > 0.05); *p < 0.05; **p < 0.01; and ***p < 0.001. Source data are available online for this figure.

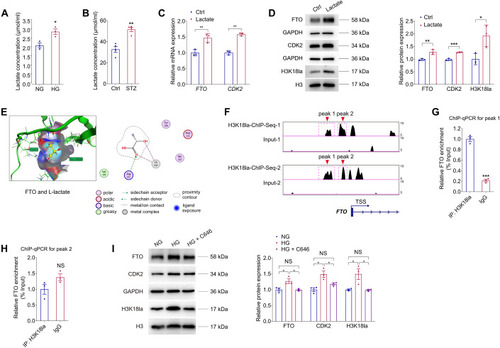
Lactic acid regulates FTO expression via histone lactylation.

(A) Lactate concentration in HUVECs treated with NG or HG. n = 3 per group. (B) Lactate concentration in neural retinas originated from control and STZ mice. n = 4 per group. (C) qPCR presents mRNA levels of FTO and CDK2 in HUVECs treated with or without lactate (10 mM). n = 3 per group. (D) Immunoblotting of FTO, CDK2 and H3K18la in HUVECs treated with or without lactate. GAPDH and H3 are used as internal controls. n = 3 per group. (E) MOE is used to predict the binding affinity between the FTO protein and L-lactate. (F) Enrichment of the H3K18la signal (two peaks) in the promoter region of the FTO gene is demonstrated by ChIP-Seq using anti-H3K18la antibodies (GEO accession number: GSE156675). (G, H) ChIP-qPCR using anti-H3K18la antibodies validates H3K18la enrichment in peak 1 but not peak 2 within the promoter region of FTO in HUVECs. n = 3 per group. (I) Immunoblotting of FTO, CDK2 and H3k18la in HUVECs with different treatments. GAPDH and H3 are used as internal controls. n = 3 per group. Data information: Data represent different numbers (n) of biological replicates. Data are shown as mean ± SEM. Two-tailed Student’s t test is used in (AD, GH). One-way ANOVA followed by Bonferroni’s test is used in (I). NS: not significant (p > 0.05); *p < 0.05; **p < 0.01; and ***p < 0.001. Source data are available online for this figure.

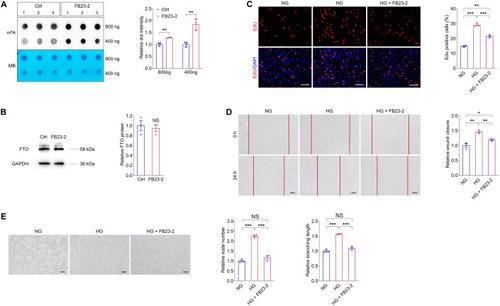
FB23-2 suppresses demethylation activity of FTO to inhibit diabetes induced endothelial phenotypes in vitro.

(A) m6A dot blot assay of global m6A abundance in HUVECs treated with or without FB23-2 (2 µM) using 800 or 400 ng total RNAs. MB staining is used as a loading control. n = 3 per group. (B) Immunoblotting of FTO in HUVECs treated with or without FB23-2. GAPDH is used as an internal control. n = 3 per group. (C) EdU assay on HUVECs treated with NG, HG, as well as HG and FB23-2. n = 3 per group. Scale bar: 60 µm. (D) Scratch test on HUVECs receiving indicated treatments. n = 3 per group. Scale bar: 100 µm. (E) Tube formation analyses on HUVECs treated with NG, HG, as well as HG and FB23-2. n = 3 per group. Scale bar: 100 µm. Data information: Data represent different numbers (n) of biological replicates. Data are shown as mean ± SEM. Two-tailed Student’s t test is used in (A, B). One-way ANOVA followed by Bonferroni’s test is used in (CE). NS: not significant (p > 0.05); *p < 0.05; **p < 0.01; and ***p < 0.001. Source data are available online for this figure.

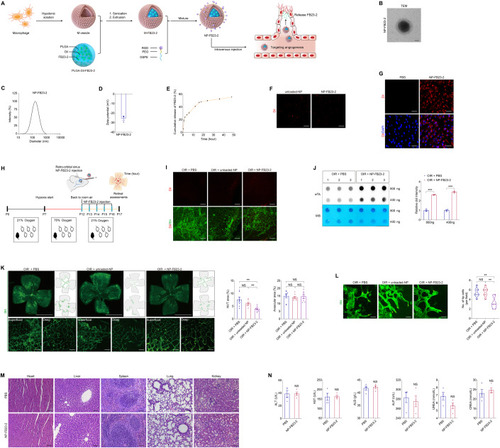
Characteristics of NP-FB23-2 and evaluation of its therapeutic efficacy on retinal neovascularization in mice.

(A) Experimental scheme illustrating the synthetic procedures of NP-FB23-2. (B) TEM of Dil labeled NP-FB23-2. n = 3. Scale bar: 50 nm. (C) The size distribution profile of NP-FB23-2s. (D) The surface zeta potential of NP-FB23-2s. n = 3. (E) Release of FB23-2 from NP-FB23-2s in PBS at 37 °C over the course of 48 h. (F) Fluorescence demonstrated by Dil labeled unloaded-NP and NP-FB23-2s. Scale bar: 20 µm. (G) Fluorescent images of HUVECs treated with PBS or NP-FB23-2s. Cell nuclei are counterstained with DAPI. n = 3 per group. Scale bar: 65 µm. (H) Experimental scheme for (IL). (I) Fluorescent images of neural retinas collected from OIR mice intravenously injected with PBS, unloaded-NP or NP-FB23-2s. Retinal vasculatures are stained with IB4. n = 3 per group. Scale bar: 50 µm. (J) m6A dot blot assay of global m6A abundance in retinas of OIR mice intravenously injected with PBS or NP-FB23-2s at P17 using 800 or 400 ng total RNAs. MB staining is applied as a loading control. n = 3 per group. (K) Fluorescence staining of IB4 in retinal flat mounts originated from OIR mice intravenously injected with PBS, unloaded-NP or NP-FB23-2s at P17. n = 8 per group. Superficial and deep vascular plexuses are shown by magnificent images. Gray dotted lines indicate the edge of the retina. Red lines suggest the avascular area. NVTs are represented by red dots. Representative images along with quantification results of NVT and avascular areas are shown. Scale bar: 2000 µm (up); 50 µm (below). (L) Fluorescence staining of IB4 in retinal flat mounts originated from OIR mice with indicated treatments at P17. n = 7 per group. Tip cells are represented by yellow asterisks. Scale bar: 30 µm. (M) Representative H&E staining images of major organs including the heart, liver, spleen, lung and kidney from mice intravenously injected with PBS or NP-FB23-2s. n = 3 per group. Scale bar: 75 µm. (N) Blood ALT, AST, CREA, UREA, ALB and ALP levels in mice intravenously injected with PBS or NP-FB23-2s. n = 4 per group. Data information: Data represent different numbers (n) of biological replicates. Data are shown as mean ± SEM. Two-tailed Student’s t test is used in (J, N). One-way ANOVA followed by Bonferroni’s test is used in (K, L). NS: not significant (p > 0.05); *p < 0.05; **p < 0.01; and ***p < 0.001. Source data are available online for this figure.

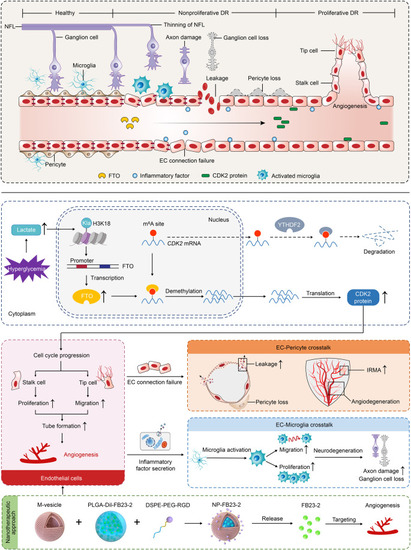
Schematic diagram of FTO-mediated effects on DR.

Driven by histone lactylation H3K18la, FTO up-regulation in ECs triggers vascular endothelial tip cell formation and its crosstalk with pericyte and microglia to aggravate diabetes-induced microvascular dysfunction. FTO mediates DR phenotypes via regulating CDK2 mRNA stability with YTHDF2 as the reader in an m6A-dependent manner.

Acknowledgments
This image is the copyrighted work of the attributed author or publisher, and ZFIN has permission only to display this image to its users. Additional permissions should be obtained from the applicable author or publisher of the image. Full text @ EMBO Mol. Med.