|
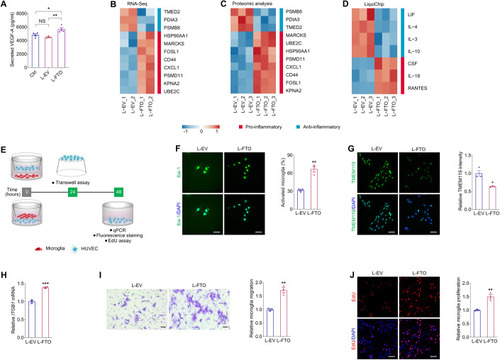
FTO triggers vascular inflammation and regulates EC-microglia crosstalk in vitro. (A) VEGF-A secretion in HUVECs detected by ELISA in the control group and HUVECs transduced with L-EV or L-FTO. n = 4 per group. (B, C) Hierarchical clustering of pro- and anti-inflammatory genes detected by RNA-Seq (B) and proteins revealed by TMT-based quantitative proteomic analyses (C) in HUVECs transduced with L-EV or L-FTO. (D) Heatmap of pro- and anti-inflammatory cytokines in the culture medium of HUVECs transduced with L-EV or L-FTO as detected by LiquiChip. (E) Experimental scheme for (F–J). (F, G) Immunofluorescence staining of Iba-1 (F) and TMEM119 (G) in microglia co-cultured with HUVECs transduced with L-EV or L-FTO. Cell nuclei are counterstained with DAPI. n = 3 per group. Scale bar: 65 µm. (H). mRNA level of ITGB1 detected by qPCR in microglia co-cultured with HUVECs transduced with L-EV or L-FTO. n = 3 per group. (I). Transwell migration assay on microglia co-cultured with HUVECs transduced with L-EV or L-FTO. n = 3 per group. Scale bar: 50 µm. (J). EdU assay on microglia co-cultured with HUVECs transduced with L-EV or L-FTO. n = 3 per group. Scale bar: 60 µm. Data information: Data represent different numbers (n) of biological replicates. Data are shown as mean ± SEM. One-way ANOVA followed by Bonferroni’s test is used in (A). Two-tailed Student’s t test is used in (F–J). NS: not significant (p > 0.05); **p < 0.01; and ***p < 0.001. Source data are available online for this figure.
|