|
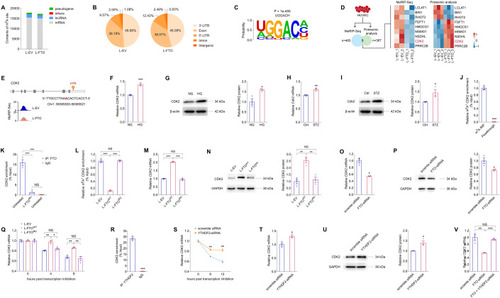
FTO regulates CDK2 mRNA stability with YTHDF2 as the reader in an m6A-dependent manner. (A, B) MeRIP-Seq data of HUVECs transduced with L-EV or L-FTO. Contents of m6A site in all types of RNAs (A) and distribution of total m6A peaks in distinct regions of mRNA transcripts (B) are presented. (C). Sequence of enriched motif displayed by HOMER. (D) Genes containing m6A-hypo peaks with altered protein expression are sorted out. (E) Abundance of m6A peak in the CDK2 transcript in HUVECs transduced with L-EV or L-FTO detected by MeRIP-Seq. Genomic location of its containing m6A site is annotated. (F, G) mRNA (F) and protein (G) expression of CDK2 in HUVECs exposed to NG or HG. β-actin is used as an internal control. n = 3 per group. (H, I) Cdk2 mRNA and protein levels detected in neural retinas of control and STZ mice. β-actin is used as an internal control. n = 3 per group. (J) MeRIP-qPCR analysis of m6A enrichment on CDK2 mRNA in HUVECs. n = 3 per group. (K) FTO-RIP-qPCR validates the binding between FTO protein and CDK2 mRNA in untreated HUVECs but not in HUVECs transduced with L-FTOMU. n = 3 per group. (L). MeRIP-qPCR analysis of m6A enrichment on CDK2 mRNA in HUVECs transduced with L-EV, L-FTOWT or L-FTOMU. (M, N) mRNA (M) and protein (N) expression of CDK2 in HUVECs transduced with indicated lentivirus. GAPDH is used as an internal control. n = 3 per group. (O, P) CDK2 mRNA (O) and protein (P) levels in HUVECs transfected with scramble siRNA or FTO-siRNA. GAPDH was used as an internal control. n = 3 per group. (Q) CDK2 mRNA levels detected by qPCR in HUVECs transduced with indicated lentivirus at 0, 4 and 8 h post actinomycin D treatment. n = 3 per group. (R) YTHDF2-RIP-qPCR validation of YTHDF2 binding to CDK2 mRNA in HUVECs. n = 3 per group. (S) CDK2 mRNA levels detected by qPCR in HUVECs transfected with scramble siRNA or YTHDF2-siRNA at 0, 6 and 12 h post actinomycin D treatment. n = 3 per group. (T, U) CDK2 mRNA (T) and protein (U) levels in HUVECs transfected with scramble siRNA or YTHDF2-siRNA. GAPDH is used as an internal control. n = 3 per group. (V) CDK2 mRNA levels detected by qPCR in HUVECs transfected with scramble siRNA, FTO-siRNA, or FTO- and YTHDF2-siRNA. n = 3 per group. Data information: Data represent different numbers (n) of biological replicates. Data are shown as mean ± SEM. Two-tailed Student’s t test is used in (F–J, O–P, R–U). One-way ANOVA followed by Bonferroni’s test is used in (K–N, Q, V). NS: not significant (p > 0.05); *p < 0.05; **p < 0.01; and ***p < 0.001. Source data are available online for this figure.
|

