- Title
-
Two zebrafish cacna1s loss-of-function variants provide models of mild and severe CACNA1S-related myopathy
- Authors
- Endo, Y., Groom, L., Wang, S.M., Pannia, E., Griffiths, N.W., Van Gennip, J.L.M., Ciruna, B., Laporte, J., Dirksen, R.T., Dowling, J.J.
- Source
- Full text @ Hum. Mol. Genet.
|
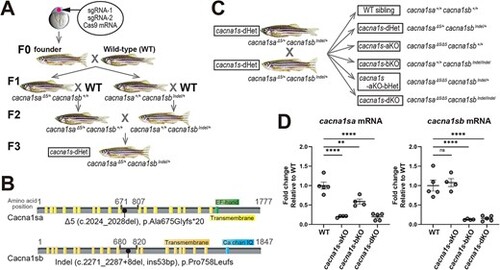
Generation of cacna1s mutant fish. (A) Schematic workflow of establishing cacna1s trans heterozygous mutants. sgRNA-1 was used for cacna1sa gene editing and sgRNA-2 for cacna1sb. The sequences of the gRNAs are described in the methods and Supplementary Fig. S1. (B) Schematics showing domains of Cacna1sa and Cacna1sb proteins and the obtained mutations. Yellow: transmembrane domain, Green: EF-hand domain, Blue (Ca chan IQ): voltage gated calcium channel IQ domain. (C) Progeny achieved by crossing cacna1s-dHet mutants. (D) mRNA levels of cacna1sa and cacna1sb in 6 dpf fish pools (WT; n = 5, aKO; n = 4, bKO; n = 4, dKO; n = 5). Values are Mean ± SEM (fold); cacna1sa: WT (1.00 ± 0.09), aKO (0.20 ± 0.01), bKO (0.59 ± 0.07), dKO (0.20 ± 0.04); cacna1sb: WT (1.00 ± 0.14), aKO (1.08 ± 0.10), bKO (0.13 ± 0.01), dKO (0.15 ± 0.03). Statistical analysis was performed using one-way ANOVA followed by Dunnett?s multiple comparisons test with P < 0.01 (**), P < 0.0001(****) or non-significance (ns). |
|
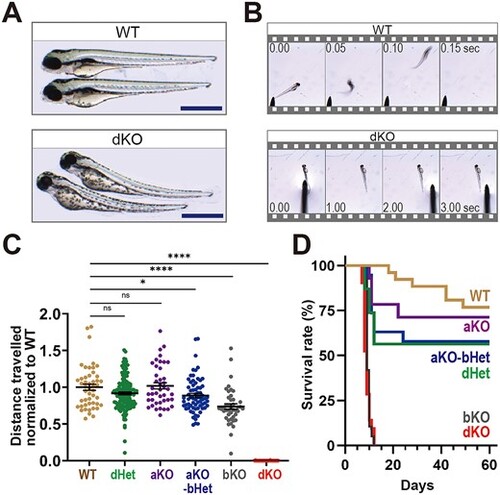
Characterization of cacna1s mutant larvae. (A) Representative bright field images of 4 dpf embryos. A total of 10 embryos per group were imaged. cacna1s-dKO larvae exhibited curved body axis. Scale bars = 1 mm. (B) Representative snapshots of touch-evoked response of 4 dpf larvae. A total of five fish per group were captured for video. WT zebrafish swim away rapidly after touch stimulation, while cacna1s-dKO showed no response or movement (see also Supplement Movies). (C) Quantification of motor ability of mutant fish (6 dpf). Total distance traveled during photochemical activation was normalized to the average of WT siblings and plotted (WT; n = 48, dHet; n = 136, aKO; n = 42, aKO-bHet; n = 69, bKO; n = 43, dKO; n = 28). Values are Mean ± SEM (mm); WT (1.00 ± 0.04), dHet (0.92 ± 0.02), aKO (1.02 ± 0.04), aKO-bHet (0.89 ± 0.03), bKO (0.74 ± 0.04), dKO (0.00 ± 0.00). Statistical analysis by one-way ANOVA followed by Dunnett?s multiple comparisons tests where P < 0.05 (*) and P < 0.0001 (****). (D) Kaplan-Meier curve showing reduced survival in cacna1s-dKO (n = 21, median survival = 9 days) and cacna1s-bKO (n = 19, median survival = 9 days, gray), but not in cacna1s-dHet (n = 23), cacna1s-aKO-bHet (n = 19), cacna1s-aKO (n = 14) or WT siblings (n = 26). Log-rank test: WT vs dKO; P < 0.0001, WT vs bKO; P < 0.0001, WT vs aKO; P = 0.2830, WT vs dHet; P = 0.1171, WT vs aKO-bHet; P = 0.1213. |
|
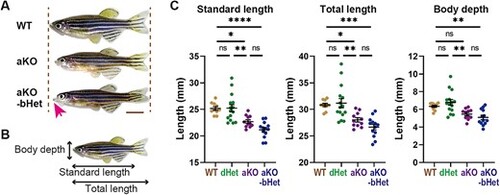
Characterization of adult cacna1s mutants. (A) Representative appearance of 7 months-old fish. cacna1s-aKO and cacna1s-aKO-bHet fish were smaller than WT, with cacna1s-aKO-bHet showing protruding jaw (arrow). Scale bar = 5 mm. (B) Schematic showing standard length, total length, and body depth measurements. (C) Standard length, total length, and body depth were measured and plotted; WT siblings (n = 15), dHet (n = 10, green), aKO (n = 11) and aKO-bHet (n = 13). All values are mean ± SEM (see Supplementary Table S1). Differences were analyzed by Tukey?s multiple comparisons test and considered to be statistically significant at P < 0.05 (*), P < 0.01 (**) P < 0.001 (***) or P < 0.0001(****). |
|
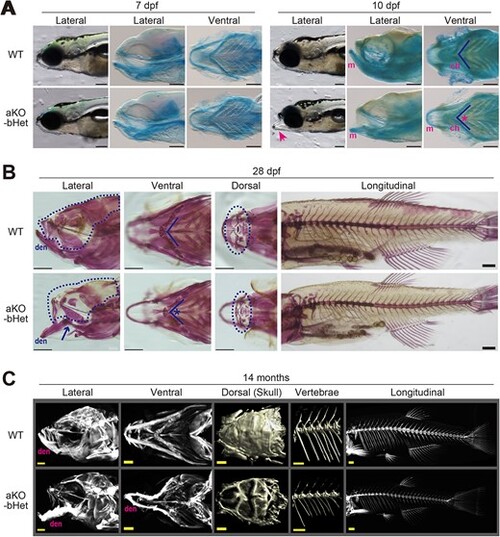
Morphological analysis on cacna1s-aKO-bHet. (A) At 7dpf, bright field (left) and alcian blue staining images (middle and right) showed no obvious difference between WT and aKO-bHet mutants in mandible development. At 10 dpf, aKO-bHet mutants could be recognized by protruding jaw (arrow). Meckel?s cartilage of mutants were dislocated as dropping in the lateral view of alcian blue staining, and ceratohyal angle (asterisk) of mutants was narrower than that of WT. The angle between the two ceratohyal elements is highlighted (right most panels, chevron shaped line). Abbreviations: m, Meckel?s cartilage; Ch, ceratohyal bone. Scale bars: 200 ?m. A total of 8 larvae per group were imaged. (B) Representative imaging of WT and aKO-bHet stained with alizarin red at 28 dpf. Lateral view of mutant revealed the jaw joint (arrow) positioned upward therefore the dentary bones downturned. The ossification of the craniofacial bones in upper jaw and skull (dashed lines in lateral and dorsal views) were severely decreased in aKO-bHet mutants compared to WTs. The ceratohyal angle (asterisk) of mutants was narrower than that of WT, and non-progressive compared to that of 10 dpf. There was no difference in spinal formation and mineralization between WT and mutants, while vertebrae and fin rays of mutants were thinner than that of WT in the longitudinal view. Abbreviations: den, dentary bone. Scale bars: 500 ?m. A total of 8 samples per group were imaged. (C) The micro-CT reconstruction images of WT and aKO-bHet mutant at the age of 14 months. Lateral view of mutant exhibited that the dentary bone was dislocated with increased calcification and irregular margins, and that upper jaw elements were smaller than that of WT. Ventral view of mutant showing significantly narrowed snout, mouth, and jaw due to the deformity of mandibular bones. Dorsal view of mutant?s skulls displays a lower density compared to WT. The vertebrae and spine of mutant were thin and shortened, corresponding to the body size. Abbreviations: den, dentary bone. Scale bars: 1 mm. A total of 2 samples per group were analyzed. |


